
Abstract
BACKGROUND AND PURPOSE: Previous hippocampal proton MR spectroscopic imaging distinguished patients with schizophrenia from controls by elevated Cr levels and significantly more variable NAA and Cho concentrations. This goal of this study was to ascertain whether this metabolic variability is associated with clinical features of the syndrome, possibly reflecting heterogeneous hippocampal pathologies and perhaps variability in its “positive” (psychotic) and “negative” (social and emotional deficits) symptoms.
MATERIALS AND METHODS: In a sample of 15 patients with schizophrenia according to the Diagnostic and Statistical Manual of Mental Disorders, Fourth Edition, we examined the association of NAA and Cho levels with research diagnostic interviews and clinical symptom ratings of the patients. Metabolite concentrations were previously obtained with 3D proton MR spectroscopic imaging at 3T, a technique that facilitates complete coverage of this small, irregularly shaped, bilateral, temporal lobe structure.
RESULTS: The patient cohort comprised 8 men and 7 women (mean age, 39.1 [SD, 10.8] years, with a mean disease duration of 17.2 [SD, 10.8] years. Despite the relatively modest cohort size, we found the following: 1) Elevated Cho levels predict the positive (psychotic, r = 0.590, P = .021) and manic (r = 0.686, P = .005) symptom severity; and 2) lower NAA levels trend toward negative symptoms (r = 0.484, P = .08). No clinical symptoms were associated with Cr level or hippocampal volume (all, P ≥ .055).
CONCLUSIONS: These preliminary findings suggest that NAA and Cho variations reflect different pathophysiologic processes, consistent with microgliosis/astrogliosis and/or lower vitality (reduced NAA) and demyelination (elevated Cho). In particular, the active state–related symptoms, including psychosis and mania, were associated with demyelination. Consequently, their deviations from the means of healthy controls may be a marker that may benefit precision medicine in selection and monitoring of schizophrenia treatment.
ABBREVIATIONS:
- AP
- anterior-posterior
- 1H-MRSI
- proton MR spectroscopic imaging
- IS
- inferior-superior
- LR
- left-right
Schizophrenia and related psychoses are debilitating disorders affecting >1% of the population. Its clinical features include psychosis (hallucinations, delusions, disorganization) and decreased emotional expression and avolition (negative symptoms), along with declining function and frequent mood symptoms.1 While commonly approached and treated as 1 disorder, schizophrenia is a heterogeneous syndrome with mounting evidence that different genetic susceptibilities and exposures may produce different initiating pathophysiologies.2,3
Hippocampal disruption may be a central pathology for psychosis because many of its measures differ between patients with schizophrenia and healthy controls, eg, reduced volume, increased resting blood flow, impaired task-related activation, decreased neurogenesis, and reduced connectivity with other regions.4⇓⇓⇓⇓⇓-10 Because the disease entails cognitive and attention deficits, effort-independent methods, eg, 3D proton MR spectroscopic imaging (1H-MRSI) of the hippocampal formation, are well-suited to both elucidating the etiology of schizophrenia and monitoring its treatments.11 1H-MRSI yields metabolic markers of several cellular processes, most notably NAA for neuronal integrity, Cr (phosphocreatine and creatine) for energy metabolism, Cho (choline, phosphocholine, and glycerophosphocholine) for membrane turnover and astroglia proliferation, and mIns for inflammation and gliosis.12,13
Most hippocampus 1H-MR spectroscopy literature reports on schizophrenia consider group-level differences in metabolite concentrations between patients and matched healthy controls.11,14,15 For example, a recent whole-hippocampus 1H-MRSI study of patients with schizophrenia found only significant, 19%, elevated mean Cr concentrations and 10% lower structure volume compared with healthy controls.16 Although the mean NAA and Cho levels in that study did not differ between the 2 cohorts, their within-group variability was significantly greater in the schizophrenia group than in the controls.16 While this greater variance may have reduced statistical power to detect group differences, it may come as no surprise, considering the etiologic and clinical heterogeneity of the disease and myriad treatment paradigms and durations.
Because this heterogeneity impedes therapeutic success, there is an ongoing research to define biologic subtypes with clinical significance. Because 1H-MR spectroscopy is often used to identify disease markers leading to personalized treatments,17 we set out to investigate whether this variability of Cho and NAA levels in patients with schizophrenia could reflect clinical symptoms, even absent group differences from the controls. This report presents preliminary findings and analysis of NAA, Cr, Cho, and mIns variability with respect to the clinical symptoms of patients with schizophrenia to test the hypothesis that their variations reflect the patient’s clinical presentation.
MATERIALS AND METHODS
Participants
Subjects were recruited from a pool of 19 patients with established schizophrenia according to the Diagnostic and Statistical Manual of Mental Disorders, Fifth Edition, who participated in a previous 1H-MRSI and MR imaging study. Fifteen (9 men, 6 women, mean age 41.60 [SD, 10.8] years; mean disease duration 18 [SD, 10.02] years) consented to enroll (see Table 1 for demographic information). All were on stable medication regimens for at least a month before their recruitment. They were assessed with the Positive and Negative Syndrome Scale,18 to generate ratings for positive (psychotic), negative (social and emotional deficits), and general psychopathology statuses. Depression and anxiety were assessed with the Hamilton Depression Rating Scale and the Hamilton Anxiety Rating Scale;19 the Young Mania Rating Scale was used to assess manic symptoms,20 all compiled in Table 2. All subjects provided New York University School of Medicine Institutional Review Board–approved written informed consent.
Demographics, metabolic, and symptomatic characteristics of the 15 patients, arranged in ascending age
Corresponding psychiatric symptoms for each of the 15 patients in Table 1
MR Imaging Acquisition and Postprocessing
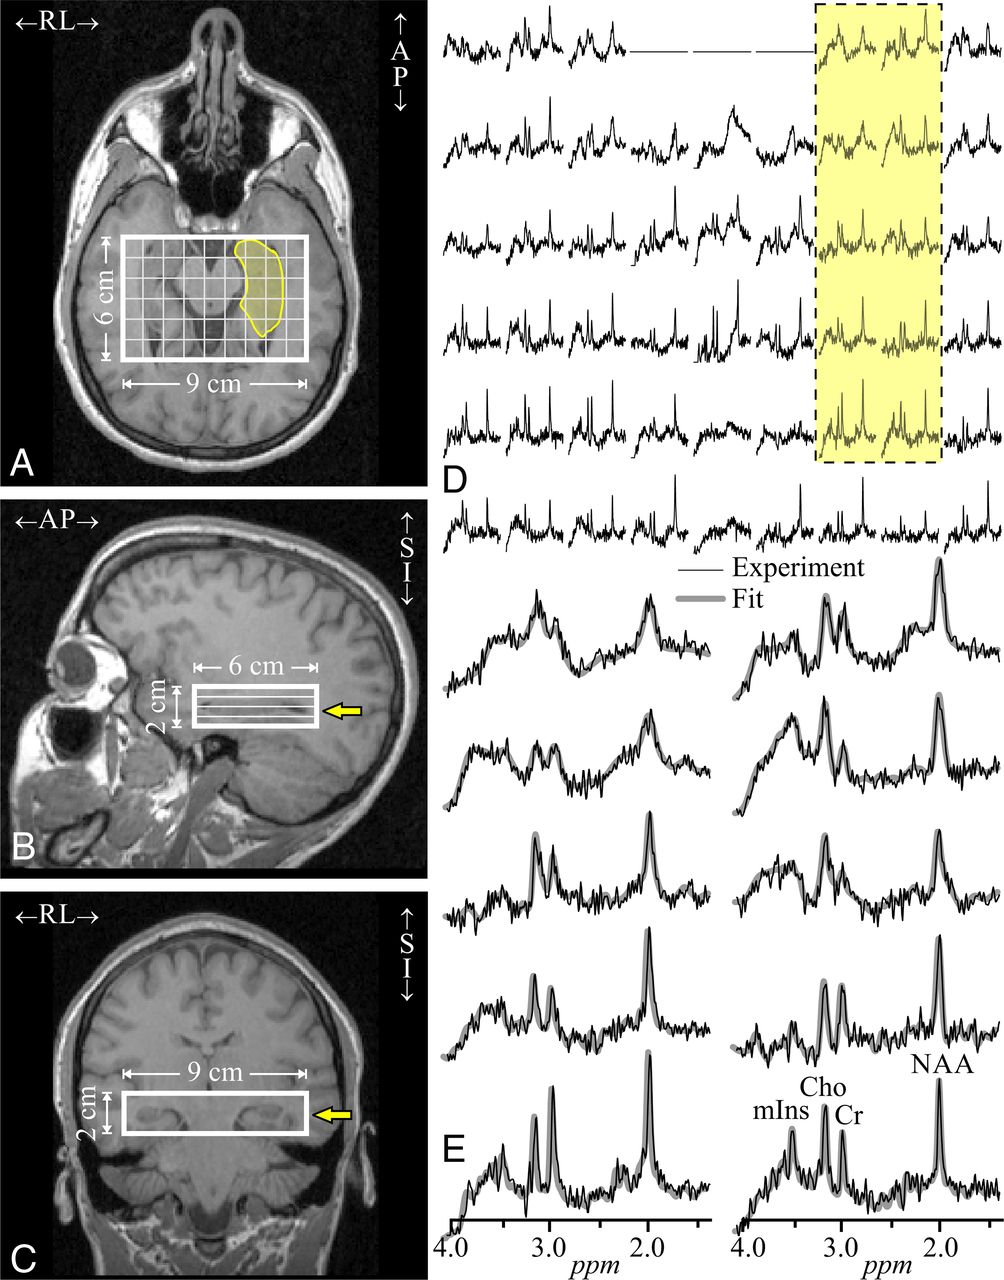
MR imaging and 1H-MRSI were performed on a 3T whole-body MR imaging scanner (Trio; Siemens) with an after-market, circularly-polarized transmit-receive head coil (TEM-3000 MRInstruments Inc. Minneapolis MN). For tissue segmentation and 1H-MRSI VOI guidance, T1-weighted, 3D MPPAGE images were obtained from each subject: TE/TI/TR = 2.6/800/1360 ms, matrix = 256 × 256, FOV = 256 × 256 mm2, 1-mm-thick slices = 160, reformatted into sagittal and coronal slices at 1-mm3 isotropic resolution, tilted along the hippocampal axis, as shown in Fig 1A–C.

Imaging and 1H-MRSI position, size, and analysis. Left images: Axial (A), coronal (B), and sagittal (C) T1-weighted MRIs from a 23-year-old male patient (No. 2 in Table 1), superimposed on the 9 × 6 × 2 cm3 LR × AP × IS VOI and the 1H-MRSI grid (thick and thin white frames) and the left hippocampus outline (transparent yellow on A). Yellow arrows on B and C indicate the level of A. Right upper image: D, Real part of the 9 × 6 (LR × AP) axial 1H spectra matrix from the VOI slice on A (level marked with yellow arrows on B and C). Spectra within the hippocampus on A are marked by the dashed yellow-filled frame. Spectra are on a common frequency and intensity scale. Right lower image: E, The 10 spectra in the frame (D) that mostly covers the left hippocampus, expanded for greater detail (black lines) and superimposed with the spectral fit (gray). Note the good signal-to-noise ratio and spectral resolution (mean, 8.1 [SD, 3.0] Hz line width) from the high-spatial-resolution (0.5 cm3) voxels and the fidelity of the spectral fit. SI indicates superior-inferior.
A 6-cm anterior-posterior (AP) × 9-cm left-right (LR) × 2-cm inferior-superior (IS) = 108 cm3 VOI was then image-guided over the bilateral hippocampi (Fig 1 A–C), angled along its long axis, and excited into 4 Hadamard-encoded axial slices, with a point-resolved spectroscopy sequence (TE/TR = 35/1400 ms). It yielded 6 × 9 × 4 (AP × LR × IS) = 216 voxels in the VOI, 1.0 × 1.0 × 0.5 cm3 each, as shown in Fig 1A–C.21 The 3D 1H-MRSI data were reconstructed off-line using in-house software, as shown in Fig 1D. The relative NAA, Cr, Cho, and mIns levels of each voxel were obtained with the spectral modeling package of Soher et al22 as shown in Fig 1E and scaled into absolute millimolar concentrations with phantom replacement, according to Meyer et al.16
Bilateral (left + right) hippocampal masks were traced by a trained neuroradiologist on the original sagittal MPRAGE images. The tracing was based on the well-known, extensively validated Harmonized Protocol, developed by the European Alzheimer’s Disease Consortium.23,24 It prescribes guidelines for labeling the entire hippocampal formation from native-space high-resolution T1-weighted MR imaging. To edit and inspect the 3D hippocampal masks in axial, sagittal, and coronal views, we used the FireVoxel package (https://firevoxel.org). FireVoxel then resampled the left + right hippocampal masks along the long axis of each subject’s hippocampus at the same inclination (ie, parallel and naturally coregistered) to the 1H-MRSI VOI, as shown in Fig 1. The CSF and white matter partial volume–corrected 1H-MRSI metabolite concentrations within each subject’s hippocampus mask, as well as the volume of the masks themselves, were then estimated using the Matlab software package (MathWorks), described by Tal et al.25
Statistical Analyses
SPSS (Version 21.0; IBM) was used for analyses. The data were normally distributed (all Kolmogorov–Smirnov test P values were ≥ .20 except the Young Mania Rating Scale, which was P = .09); thus, the association between clinical symptom ratings and the Cho, NAA, Cr levels and hippocampal volumes were examined using Pearson correlations. All tests were 2-tailed, and the α for significance was set at P < .05.
RESULTS
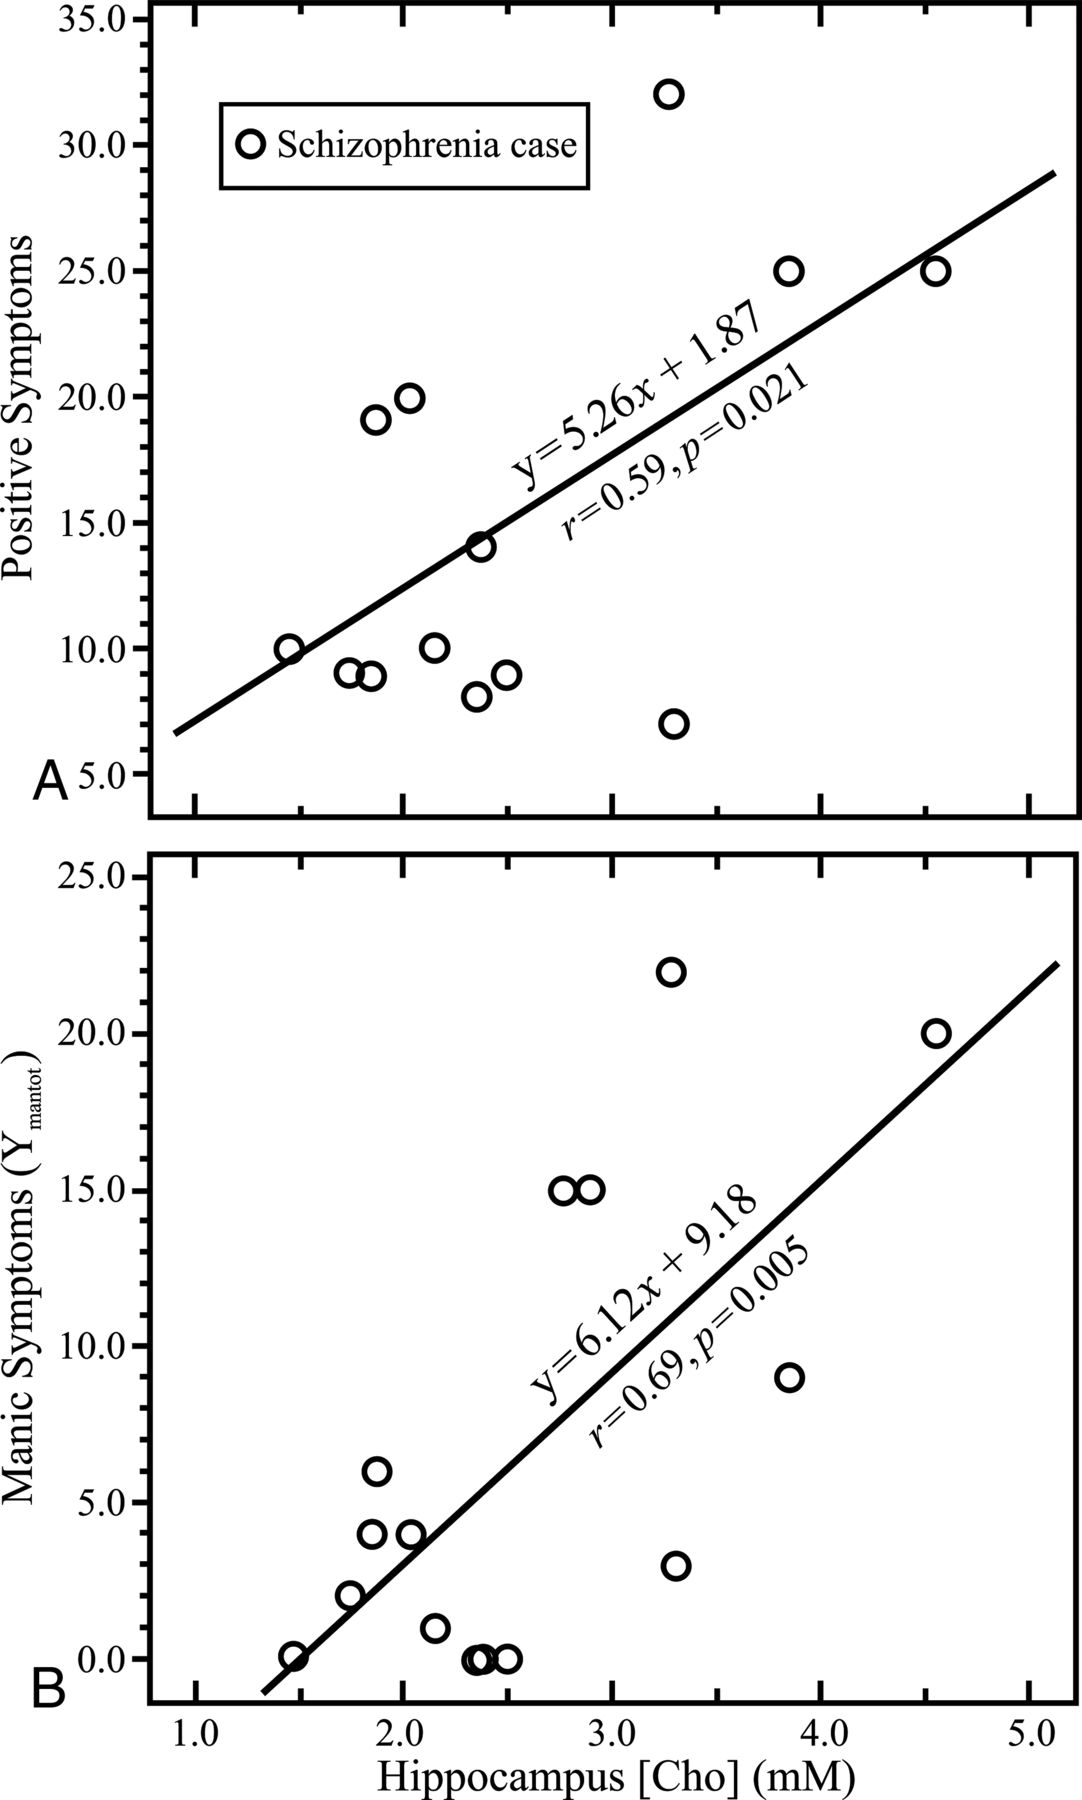
Individual scores and sample means ± SDs for the hippocampal metabolite concentrations and volumes are compiled in Table 1, and the psychiatric symptoms are presented in Table 2. There was a positive association between Cho levels and the Positive and Negative Syndrome Scale–positive symptoms (r = 0.59, P = .021) and manic symptoms (r = 0.69, P = .005), as shown in Fig 2. There was a trend association of the NAA with negative symptoms (r = 0.48, P = .08). No clinical symptoms were associated with Cr levels or the hippocampal volume (all, P values ≥ .055).

Symptoms and metabolite concentrations. Upper graph: A, Correlations between positive (psychotic) symptoms assessed with the Positive and Negative Syndrome Scale18 and whole-hippocampus multivoxel average choline millimolar concentration of Cho. Lower graph: B, Same for manic symptoms measured with the Young Mania Rating Scale and whole-hippocampus average of Cho.
DISCUSSION
Most of the 1H-MR spectroscopy schizophrenia studies published to date focus on the search for group-concentration differences from matched healthy controls.14 The usual rationale is the search for a singular underlying disease pathology, rather than a clinical phenotype within the syndrome. Moreover, the variability in metabolite concentrations that could be used to explore different subtypes of the disease with different molecular pathologies may, instead, reduce the power to find group differences. Thus, approaching schizophrenia as a singular condition (though acknowledged to be a heterogeneous syndrome) may lead to the findings of “no intercohort difference.” This may explain the paucity of Cho, mIns, and Cr patient-versus-control intercohort difference reports in the literature and perhaps, consequently, the even greater rarity of these concentration relationships to the patient’s clinical symptoms.
These preliminary findings support the hypothesis that some of the variability in the patent’s clinical symptoms is related to the hippocampal metabolite concentrations and the different molecular pathologies they indicate. This is especially germane because biomarkers that follow clinical symptoms would be particularly helpful in early-psychosis groups, including first-episode, prodromal, and clinical high-risk subjects. For example, during early-psychosis presentation, psychiatric history is often limited, but successful long-term outcomes rely on accurate diagnosis and quick intervention.26 Identifying molecular pathologies in the hippocampus is particularly poignant in this population. Indeed, studies of subjects at high risk for psychosis have identified changes in hippocampal volume and glutamate and glutamine concentrations.27,28
This study suggests that 2 different hippocampal inflammatory pathologies may occur in different cases of schizophrenia, identified by elevated Cho, a marker for demyelination, and reduced NAA, an indicator of neuronal integrity. In support of the proposition that these processes are independent, the cases with the highest Cho levels also had mild NAA elevation. Elevated Cho was specifically related to state-related active symptoms of psychosis and mania.
Reduced hippocampal NAA is consistent with astrocytosis and/or microgliosis, shown in a murine model of HIV-1 encephalitis29 and consistent with the elevated Cr levels, which correlated with mIns levels for the entire group of cases versus controls.16 The relationship of Cho with the cases of more severe manic and psychotic symptoms suggests that the pathologic processes associated with their active positive symptoms may entail myelination disruption.
Note that the inhibitory parvalbumin-positive GABAergic hippocampal interneurons are myelinated in an experience-dependent manner.30 With diminished hippocampal input, the number and function of the inhibitory GABAergic neurons would be reduced, shifting the balance to the more numerous N-methyl-D-aspartate receptor glutamatergic activity, thereby activating pathways that can deregulate dopamine homeostasis and produce psychosis.31 Such a model would support our finding of Cho predicting psychotic and manic symptoms. Furthermore, the fact that Cho, a marker of membrane de- and remyelination, is linked to psychosis severity supports a mechanism of dysmyelination in schizophrenia that is also supported by a postmortem study showing that 35 of 89 cases examined expressed abnormal myelination in the prefrontal lobes.32
This study focused on the variability of metabolite concentrations as a probe of the underpinnings of hippocampal pathology in psychosis. The presence of separate hippocampus-related pathologies may help reconcile the diverse findings reported for schizophrenia better than single models that include effects of age or progression of a single pathophysiology.33 These findings are also consistent with a model of increased hippocampal hyperactivation or perfusion9 and pathology that reduces hippocampal volumes.34
This study is also subject to some limitations. First, it is a small (n = 15) sample comprising patients of varying disease durations. While all were on clinically determined medication doses, unchanged for at least a month, their treatments varied in both type and duration. Second, the quantitative metabolic results are subject to inherent limitations of 1H-MR spectroscopy: relatively low spatial resolution compared with the hippocampus internal structure, precluding, for example, differentiation of its subfields. Yet, even despite these limitations, our results suggest that individual 1H-MRSI metrics may be used to help characterize the clinical presentation of patients with schizophrenia with hippocampal metabolic deviations compared with healthy controls.
CONCLUSIONS
A combination of advanced multivoxel 3D 1H-MRSI acquisition facilitating total spatial coverage of this bilateral structure and postprocessing methodology that corrects for partial volume effects allowed us to detect and distinguish separate hippocampal pathologies consistent with glial activation and demyelination that predict different psychiatric symptoms in patients with schizophrenia. These preliminary findings, if replicated in a larger study, also suggest that a patient’s specific 1H-MRSI metrics may be used to select and monitor individually tailored treatments for psychosis and mania;17 for example, they may benefit from anti-inflammatory treatments.
Acknowledgment
The authors wish to acknowledge the contributions of Emma J. Meyer, who died before the publication of this article.
Footnotes
This work was supported by National Institutes of Health grants MH59114, MH088843, MH001699, MH086651 and P41 EB017183.
Disclosures: Dolores Malaspina—RELATED; Grant; National Institute of Mental Health*; UNRELATED: Employment: Icahn School of Medicine at Mount Sinai, New York, New York, Comments: Professor. Julie Walsh-Messinger—UNRELATED: Expert Testimony: Strauss Troy LLC, Comments: I provided expert witness testimony on schizophrenia in November 2018. My purpose was to educate the court on the disease, and I did not conduct a forensic evaluation; Stock/Stock Options: I do not believe I have relevant stock. I have a retirement account that my financial advisor handles, but I do not know what he has invested it in. Oded Gonen—RELATED: Grant: National Institutes of Health, Comments: MH59114, MH088843, MH001699, MH086651, EB017183*; UNRELATED: Employment: New York University School of Medicine, Comments: salary. *Money paid to the institution.
Indicates open access to non-subscribers at www.ajnr.org
References
- Received April 1, 2020.
- Accepted after revision August 17, 2020.
- © 2021 by American Journal of Neuroradiology


