
Abstract
BACKGROUND AND PURPOSE: MR changes in denervated muscles have been reported to occur within days up to several weeks after peripheral nerve damage. The purpose of this experimental study was to investigate the longitudinal changes in denervated muscles by using MR imaging.
METHODS: In 12 Lewis rats, the left sciatic nerve was transected at the level of the proximal thigh. MR imaging of both legs was performed before and 1 hour, 24 hours, 48 hours, 7 days, 14 days, 28 days, and 2 months after the procedure. The MR protocol included T1-weighted spin-echo, T2-weighted double turbo spin-echo, and turbo inversion recovery magnitude (TIRM) sequences obtained in the axial plane. Signal intensities (T2-weighted double turbo spin-echo and TIRM sequences) and the T2 TR (T2-weighted double turbo spin-echo sequence) were recorded for the soleus, peroneal, and gracilis muscles of both sides. Moreover, the circumferences of both lower legs were determined on the basis of T1-weighted images.
RESULTS: Twenty-four hours after denervation, a signal intensity increase in the denervated peroneal and soleus muscles was present on TIRM images. On T2-weighted images, only the peroneal muscle exhibited slightly increased signal intensities and T2 TR. Forty-eight hours after nerve transection, the denervated soleus and peroneal muscles revealed prolonged T2 TR and marked increased signal intensities on T2-weighted and TIRM images when compared with the contralateral side, which further increased at or less than 2 months after denervation. Muscle atrophy of the denervated muscles was present as early as 7 days after denervation and was also increased at follow-up examinations.
CONCLUSION: The TIRM sequence is more sensitive than is T2-weighted imaging in the detection of signal intensity changes in denervated muscle. These changes occur as early as 24 (TIRM sequence) and 48 (T2-weighted sequence) hours, respectively, after complete transection of the sciatic nerve in rats and precede muscle atrophy. The sensitivity to early signal intensity changes in denervated muscles may support the use of MR imaging in the diagnosis of peripheral nerve lesions.
Denervation of skeletal muscles may be caused by lesions of the peripheral nerve, the plexus, or the nerve root. In addition to the clinical examination, the diagnosis of denervated muscles is commonly based on electromyography (EMG) showing absence or reduction of motor unit recruitment during voluntary movement and fibrillation potentials at rest. The EMG findings are dependent on the extent of nerve damage and the interval between the nerve injury and the EMG investigation. After complete axonal damage of the rat sciatic nerve, the earliest positive EMG findings have been described after 3 days (1). Recently, MR imaging has been introduced in the diagnosis of denervated muscles. The MR imaging findings are characterized by a prolongation of both the T1 and T2 TR (2). Until now, only few experimental studies have been conducted to examine denervated muscles with MR imaging (2–4). In these studies, the earliest positive MR imaging findings have been reported to occur 14 to 21 days after denervation (3, 4). The purpose of this experimental study was to longitudinally investigate denervated muscles by using a clinical MR imager.
Methods
Animals
All animal experiments were approved by the Bavarian State Animal Experimentation Committee and were conducted in accordance with its regulations. A total of 12 male Lewis rats (weight, 200–250 g) were used. Animals were maintained in quiet facilities with unlimited access to water and food, controlled temperature (20–24°C), and 12-hour light schedule.
Denervation Model
For transection of the sciatic nerve, animals were deeply anesthetized with intraperitoneal application of 100 mg/kg ketamine (Ketanest) and 10 mg/kg xylazine (Rompun). After exposure of the right sciatic nerve, two sutures were placed around the nerve trunk with a distance of 3 mm between them. In the middle of the space between these two sutures, the sciatic nerve was transected.
MR Protocol
MR imaging was performed before nerve transection and was repeated 1 hour, 24 hours, 48 hours, 7 days, 14 days, 28 days, and 2 months after the procedure. All examinations were accomplished on a clinical 1.5-T MR imager (Magnetom Vision; Siemens, Erlangen, Germany). The measurements were performed with the animals under intraperitoneal anesthesia (same dosage as for nerve transection) and in a prone position with both legs positioned in a round surface coil (ø, 40 mm), which was placed in the axial plane of the legs. The MR imaging protocol consisted of a T2-weighted double turbo spin-echo sequence (2000/17/96 [TR/TE1/TE2]; field of view, 200 mm; matrix, 512 × 512; two acquisitions, bandwidth of 98 Hz/pixel), a turbo inversion recovery magnitude (TIRM) sequence (3250/60; inversion time, 150 ms; field of view, 300 mm; matrix, 512 × 512; three acquisitions, bandwidth of 130 Hz/pixel), and a T1-weighted spin-echo sequence (460/14; field of view, 100 mm; matrix, 512 × 512; two acquisitions, bandwidth of 65 Hz/pixel). All measurements were obtained in the axial plane, with a section thickness of 4 mm.
Image Analysis
In an axial section obtained 4 mm below the knee joint, a round region of interest (ø, 2 mm) was placed in the soleus, peroneal, and gracilis muscles on both sides. Mean T2 TR (for the T2-weighted double turbo spin-echo sequence by using an implemented software of the MR unit) and mean signal intensities (for the TIRM and T2-weighted images, in arbitrary units) were calculated for every region. Moreover, the circumferences of both legs were measured in the same section on T1-weighted images.
Statistical Analysis
Statistical analysis was performed by using a statistical software package (SigmaStat 2.03; SPSS, Chicago, IL). For every MR imaging examination, signal intensities and TR of denervated muscles and the corresponding unaffected muscles of the opposite side were compared by using a Mann-Whitney test. The mean circumferences of both legs for each rat were compared with the values before nerve transection by using a signed rank test.
Results
T2-Weighted Sequence and T2 Signal Intensity
Before and 1 hour after denervation, T2 TR and signal intensities in the soleus, peroneal, and gracilis muscles did not differ significantly between the left and right legs (P > .1) (Fig 1). Twenty-four hours after denervation, a significant difference was detected between the TR of the left and right peroneal muscles (39.5 [0.6] versus 41.3 [1.2], P < .05). The left and right soleus (41.5 [0.8] versus 42.4 [0.6], P = .7) and gracilis (41.4 [0.6] versus 41.6 [0.6], P > .6) muscles did not reveal significant differences at that time. Signal intensities on T2-weighted images also revealed a slightly significant difference for the peroneal (371 [19] versus 398 [27], P < .05) but not for the soleus (359 [16] versus 370 [24], P > .1) muscle. Forty-eight hours after denervation, the denervated right peroneal (40.3 [0.7] versus 44.2 [1.1], P < .001) and soleus (41.9 [0.9] versus 44.7 [1.1], P < .001) muscles showed highly significant prolongation of T2 TR when compared with the unaffected left side. At that time, the T2 signal intensities also exhibited significant side differences in the peroneal (379 [29] versus 435 [41], P < .001) and soleus (367 [28] versus 419 [36], P < .005) muscles. The gracilis muscle, which is innervated by the obturator nerve, did not reveal significant side differences of signal intensities or T2 TR (P > .5). More than 2 months after denervation, T2 TR in the denervated leg constantly increased (54.1 [1.7] in the peroneal muscle and 54.4 [1.9] in the soleus muscle) without relevant changes in the unaffected contralateral muscles and the ipsilateral gracilis muscle.

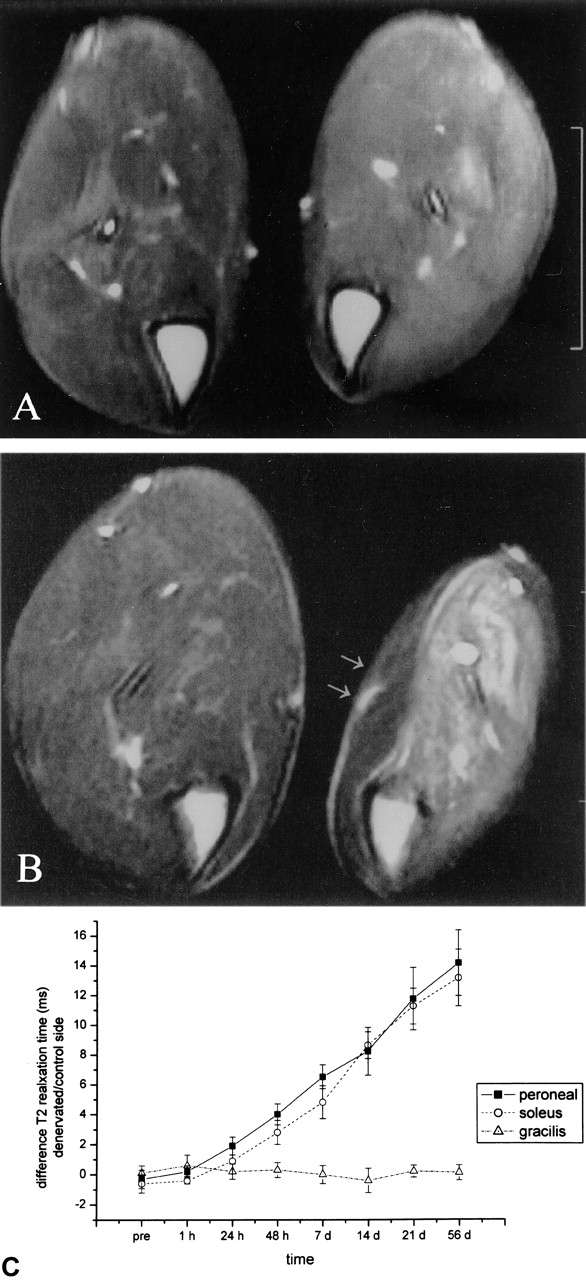
Axial T2-weighted double fast spin-echo images (2000/17/96), obtained 4 mm below the knee joint, and time course graph.
A, Obtained 48 hours after transection of the left sciatic nerve. A slight signal intensity increase in the denervated muscles of the lower leg is already present.
B, Obtained 2 months after transection of the left sciatic nerve. The signal intensity increase becomes more prominent. The gracilis muscle (innervated by the obturator nerve, arrows) is not affected.
C, Time course of the difference in T2 TR between the peroneal, soleus, and gracilis muscles of the left and right lower legs.
TIRM Sequence
In the TIRM sequence (Fig 2), no significant differences between the muscles of both legs were found before and 1 hour after denervation (P > .1). Twenty-four hours after denervation, signal intensities were significantly higher in the denervated peroneal (271 [12] versus 324 [17] arbitrary units, P < .001) and soleus (282 [11.3] versus 331 [99] arbitrary units, P < .001) muscles. The gracilis muscle did not exhibit relevant differences in signal intensity (P > .1). In the denervated peroneal and soleus muscles, the signal intensity subsequently further increased until 2 months after denervation (289 [12] versus 661 [23] arbitrary units in the peroneal muscle, P < .001; 287 [9] versus 674 [19] arbitrary units in the soleus muscle, P < .001) (Fig 2). The unaffected muscle of the opposite side and the ipsilateral gracilis did not reveal significant differences (P > .1).

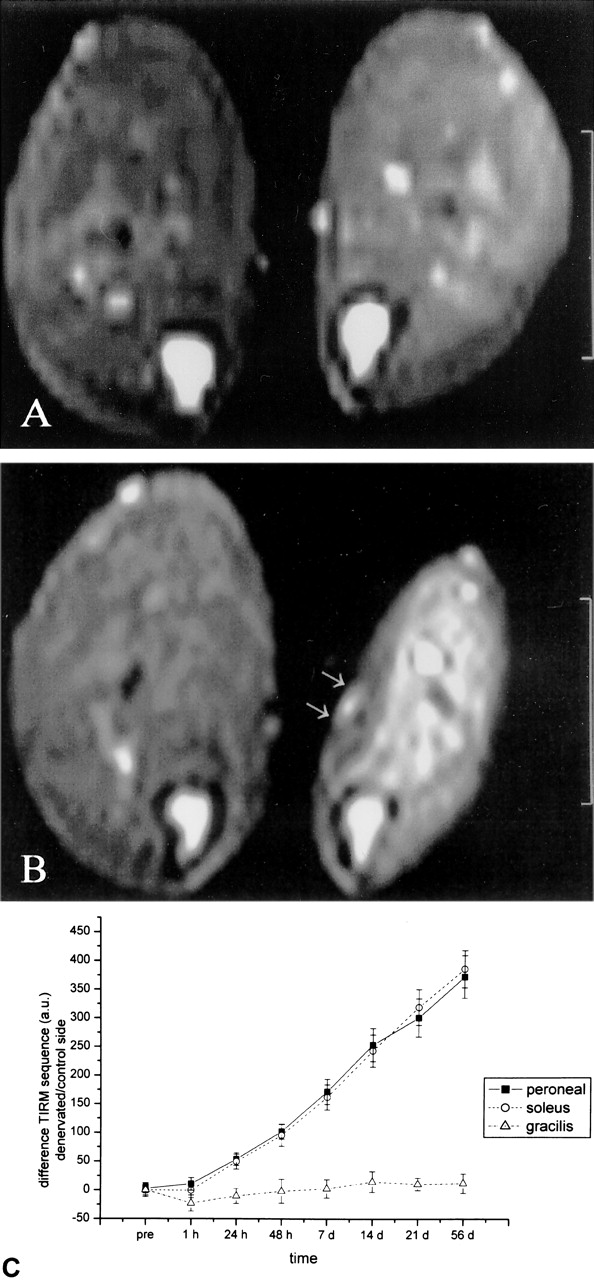
Axial TIRM images (3250/60; inversion time, 150), obtained 4 mm below the knee joint, and time course graph.
A, Obtained 48 hours after transection of the left sciatic nerve. A marked signal intensity increase in the denervated muscles is already present.
B, Obtained 2 months after transection of the left sciatic nerve. Marked signal intensity further increases.
C, Time course of the difference in signal intensity (in arbitrary units) between the left and right lower legs.
Circumference
At or less than 48 hours after denervation, no differences in the circumference of the lower leg were found (Fig 3). Seven days after transection of the nerve, the denervated leg had a smaller circumference than that of the control leg (2.1 [0.1] cm2 versus 1.6 [0.1] cm2, P < .05). At the follow-up examinations, the unaffected leg revealed a significant increase in circumference (2.6 [0.2] cm2 2 months after denervation) compared with the initial value (2.1 versus 2.6 cm2, P < .05). The denervated leg further diminished in size (1.1 [0.3] cm2), which significantly differed from the value before denervation (P < .01) and from the value of the contralateral side at that time (P < .005)

Axial T1-weighted spin-echo image (460/14), obtained 4 mm below the knee joint, and time course graph.
A, Obtained 48 hours after transection of the left sciatic nerve. No evidence of atrophy is seen.
B, Obtained 2 months after transection of the left sciatic nerve. Marked atrophy of the denervated muscles and hypertrophy of the contralateral leg can be seen.
C, Time course of the difference in circumference of the left and right lower legs.
Discussion
MR changes in denervated muscles were first described by Polak et al in 1988 (2). Fifteen days after transection of the sciatic nerve in rats, prolongation of both T1 and T2 TR was observed in the denervated muscles of the lower leg. Because the amount of extracellular fluid was enlarged in the absence of a total water increase, Polak et al hypothesized that fluid changes from the intra- to the extracellular compartment were responsible for the observed TR changes. Only two additional experimental studies performing MR imaging of denervated muscles are available. Hayashi et al (4) found prolongation of the T2 TR in the absence of T1 TR changes 2 weeks after denervation, which was correlated with an increase in blood volume. They reported that the T2 changes were caused by changes in blood volume rather than by fluid changes. Küllmer et al (3) found a prolongation of T2 as early as 21 days after denervation, which was accompanied by muscle atrophy.
Several clinical studies have reported the feasibility of MR imaging of denervated muscle (5, 6). The extent of signal intensity increase in denervated muscles was reported to be correlated with the degree of spontaneous activity as measured with EMG (7). In comparison with EMG, MR imaging has the advantages of being noninvasive and being able to visualize all muscle groups of an extremity. This may be especially helpful for children, patients with coagulopathies, and polytraumatized patients with multiple nerve lesions. Moreover, deep-seated lesions, which are hardly approachable with EMG, can easily be visualized. One major drawback of MR imaging is the lack of longitudinal experimental or clinical studies on the time course of MR changes after denervation. Until now, it is unknown at what point in time and to what extent MR signal intensity changes occur after denervation. In general, clinical studies have reported a late onset of signal intensity changes weeks after denervation (5, 6). However, for some patients, signal intensity abnormalities have been shown to occur as early as 4 days after denervation (8). In the present study, we found prolongation of the T2 TR in denervated muscle as early as 24 hours after denervation. A signal intensity increase in the TIRM sequences was present in all affected muscles 24 hours after nerve transection. Because of its sensitivity to fluid changes, the TIRM sequence is more sensitive in detecting signal intensity changes after denervation than T2-weighted sequences, which has already been reported in clinical studies (5, 6). On the other hand, T2-weighted sequences feature a markedly improved signal intensity conspicuity when compared with the TIRM sequence. The TIRM pulse sequence is a particular variant of inversion recovery preparations for contrast enhancement beyond saturation techniques. With TIRM, the contrast of tissue components is suppressed by using the very latency until passing zero magnetization after the inversion pulse was set as the inversion time. This is especially effective for components of short T2, such as fat. Depending less on the conditions of the imager and the patient, TIRM imaging is considered more robust than other techniques. Notably, the inversion with τ values of approximately 140 ms at 1.5 T does alter the particular contrast properties of other components as well.
The focus of the present study was to systematically examine the clinically relevant signal intensity changes in denervated muscles. Potential changes in the T1 TR were not studied primarily because of time limits. Generally, changes in the T1 TR in denervated muscle are under debate (2, 4) and were not thought to be of diagnostic relevance in our study. However, an effect of T1 alterations on the observed signal intensity changes cannot be excluded. Considering the selected sequence parameters as well as the previously reported values of T1 prolongation in denervated muscle (2), the latter are not likely to account for the entire amount of T2 alterations.
MR signal intensity changes markedly preceded atrophy, which was present in our study at 7 days. After 7 days, atrophy progressed to a similar degree as the signal intensity changes on T2-weighted and TIRM sequences. We did not observe any fatty infiltration on T1-weighted images throughout the 2 months of follow-up. Surprisingly, the contralateral leg exhibited a compensatory hypertrophy over time. Similar findings have been reported in association with functional overload of muscles by removing synergistic muscles (9).
The observed MR changes precede the earliest EMG findings after an experimental nerve lesion in rats (1). Because clinically, EMG denervation changes only occur late, it has been clinical practice to delay EMG examinations for 10 days or more after a nerve lesion. MR imaging may be useful in narrowing this diagnostic gap. The present study focused only on complete nerve transections. Less severe nerve damage, as in association with neurapraxia or axonotmesis, were not considered in this study and may cause less notable signal intensity changes on MR images.
The pathophysiology behind the MR signal intensity changes in denervated muscles remains unclear. An increase in blood flow has been described immediately after denervation (10), with a subsequent decline after 7 days (11). These changes have been attributed to an interruption of the sympathetic vasoconstriction and have been suggested as the basis for the MR signal intensity changes (4). The time course observed in our study contradicts this hypothesis. The earliest MR imaging findings were present 24 hours after a lesion that had interrupted all sympathetic vasoconstrictor neurons to the muscles under study. Moreover, the signal intensity in denervated muscles continued to increase until 2 months after denervation. Our findings support the hypothesis that fluid changes from the intra- to the extracellular space are responsible for the MR changes (2). However, the pathophysiologic basis for this fluid exchange remains uncertain.
Conclusion
T2 TR changes and signal intensity changes in the TIRM sequence occur as early as 24 hours after creation of an experimental nerve lesion in the rat. They markedly precede atrophy and are probably also the earliest experimental EMG changes. A continuous signal intensity increase was observed until 2 months after denervation. MR imaging holds the promise of an early and sensitive diagnosis of denervated muscles.
Acknowledgments
The authors thank Tanja Horn for the MR imaging measurements and Andreas Bartsch, MD, for critically reading the manuscript.
References
- Received December 13, 2001.
- Accepted after revision April 18, 2002.
- Copyright © American Society of Neuroradiology


