
Abstract
BACKGROUND AND PURPOSE: If venous congestion is the primary cause of pituitary gland enlargement in cases of dural arteriovenous fistulas (AVFs), other abnormal pituitary findings may be detectable on MR images. We sought to investigate the perfusion abnormality of the pituitary gland secondary to dural AVFs in the cavernous sinus and to clarify its clinical importance.
METHODS: Nine consecutive patients (all female; age range, 50–77 years) with dural AVFs in the cavernous sinus underwent prospective MR examinations, including dynamic studies, before and after therapy. Their clinical signs and symptoms were recorded. Two radiologists visually evaluated the enhancement patterns of the anterior pituitary gland. Dynamic MR curves were obtained by locating regions of interest at the center and bilateral peripheral areas of the anterior pituitary gland on coronal images. MR images obtained in five healthy individuals served as controls.
RESULTS: No patient had symptoms of hypopituitarism or other endocrine abnormalities. Asymmetric pituitary enhancement was found in five patients; the side with the dural AVF was less enhancing. This finding disappeared after therapy. Although asymmetric enhancement was not detected in the remaining four patients, statistical analysis showed significantly delayed enhancement of the pituitary gland in the patients compared with enhancement patterns in control subjects. After treatment, this delay improved significantly. The pituitary gland significantly decreased in size after treatment.
CONCLUSION: Perfusion of the pituitary gland is impaired in patients with a dural AVF in the cavernous sinus. This finding is probably due to venous congestion of the pituitary gland caused by high pressure in the cavernous sinus; it is usually not related to pituitary dysfunction.
A previous report in the literature (1) has described pituitary gland enlargement in some cases of a dural arteriovenous fistula (AVF) of the cavernous sinus. The authors attributed the enlargement of the pituitary gland to the venous congestion secondary to the markedly elevated venous pressure in the cavernous sinus, into which the drainage veins of the pituitary gland flow. If we think of the venous congestion as the primary cause of the pituitary gland enlargement, other additional abnormal findings in the pituitary gland could possibly be detected on MR images. Over the past 3 years, we prospectively performed dynamic MR examinations of the cavernous sinus in patients with a dural AVF in the cavernous sinus to evaluate the degree of thrombosis in the cavernous sinus both before and after treatment. We reviewed images from this series of MR examinations to assess findings in the pituitary gland, in addition to the pituitary enlargement, which may support the hypothesis of pituitary venous congestion. The aim of this study was to evaluate the abnormal findings in the pituitary gland in patients with a dural AVF in the cavernous sinus, especially on dynamic MR images, and to clarify its clinical importance.
Methods
During the period from 1995 to 2000, we performed MR examinations, including dynamic studies, of the cavernous sinus and pituitary gland in nine consecutive patients with an angiographically proved dural AVF of the cavernous sinus (Table 1). We reviewed the MR images and medical records to examine the presence of abnormal features and clinical symptoms suggesting the diagnosis. The patients also underwent MR examinations after the successful treatment of the disease. Therefore, a total of 18 dynamic MR examinations were included in this study. The intervals between the pretreatment and posttreatment MR examinations ranged from 1 week to 35 months, with an average of 35.8 weeks. Five normal dynamic MR examinations performed in patients with suspected micropituitary adenomas were performed with the same imaging parameters as for the patients; these five served as controls. The control subjects were two men (36 and 67 years old) and three women (51, 61, and 61 years old). The nine patients were all women aged 50–77 years, with a mean age of 64.0 years (Table 1). The patients were treated with the combined therapy of embolization of the external carotid artery, coil packing of the cavernous sinus, and/or a total of 30 Gy of radiation therapy (Table 1). Five patients were regarded as cured on the basis of conventional angiographic findings, and the other four were so regarded on the basis of the complete disappearance of the clinical symptoms and MR angiographic findings.
Summary of patients with a dural AVF in the cavernous sinus
The type of fistula was angiographically categorized according to the Barrow classification (2): type A was a direct carotid-cavernous fistula; type B, an indirect fistula supplied by the internal carotid artery; type C, an indirect fistula supplied by the external carotid artery; and type D, an indirect fistula supplied by both the internal and external carotid arteries. The definition of the cavernous sinus fistula was determined for each side of the cavernous sinus; we focused on whether the veins drained into the cavernous sinus, regardless of the location of the fistula. For instance, if the right cavernous sinus showed early enhancement on the left external carotid angiogram, the right cavernous sinus was defined as having a type C fistula.
MR imaging was performed with a 1.5-T superconductive imaging system (Magnetom Vision; Siemens, Erlangen, Germany) by using a standard circular polarized head coil. After T1- and T2-weighted coronal and sagittal precontrast imaging, dynamic imaging and consequent postcontrast imaging was performed. The dynamic MR imaging involved a fast spin-echo technique with a TR/TE/NEX of 575/15/1, an echo train length of seven, a 154 × 256 matrix, a 160 × 160 field of view, and a section thickness of 4 mm. For dynamic imaging, five coronal sections were located off of a midsagittal T1-weighted fast spin-echo image with the center section on the middle of the pituitary gland. Twelve serial dynamic datasets with five coronal sections each were obtained with a 15-second interval, starting at the initiation of a manual bolus injection of 0.1 mmol/kg of gadopentetate dimeglumine (Magnevist; Schering) into the antecubital vein. The injection was immediately followed with 20 mL of normal sodium chloride solution to complete the delivery of the entire dose of the contrast agent and to flush the vein.
Evaluation of MR Images
On the nonenhanced T1- and T2-weighted images, the size and signal intensity of the pituitary gland was evaluated visually by referring to the images of control subjects. Two experienced neuroradiologists (Y.S., Y.K.) performed all of the visual evaluations by consensus. The height of the pituitary gland was measured to the closest millimeter on a magnified coronal image of the pituitary gland both before and after the treatments. For this measurement, the computer software supplied with the MR imaging unit was used. On dynamic MR images, we evaluated the laterality of the pituitary enhancement on early dynamic images. We noted the side of the anterior pituitary gland, if any, that enhanced later on the early dynamic phases; this was designed right, left, or no laterality). On these images, we also evaluated the phase of dynamic imaging in which the enhancement the pituitary gland was homogeneous from side to side. For this purpose, the first phase of dynamic imaging on which any enhancement was apparent in the pituitary gland or stalk was defined as the earliest phase. The imaging set just before this first phase was defined as phase zero.
Evaluation of Dynamic Curves
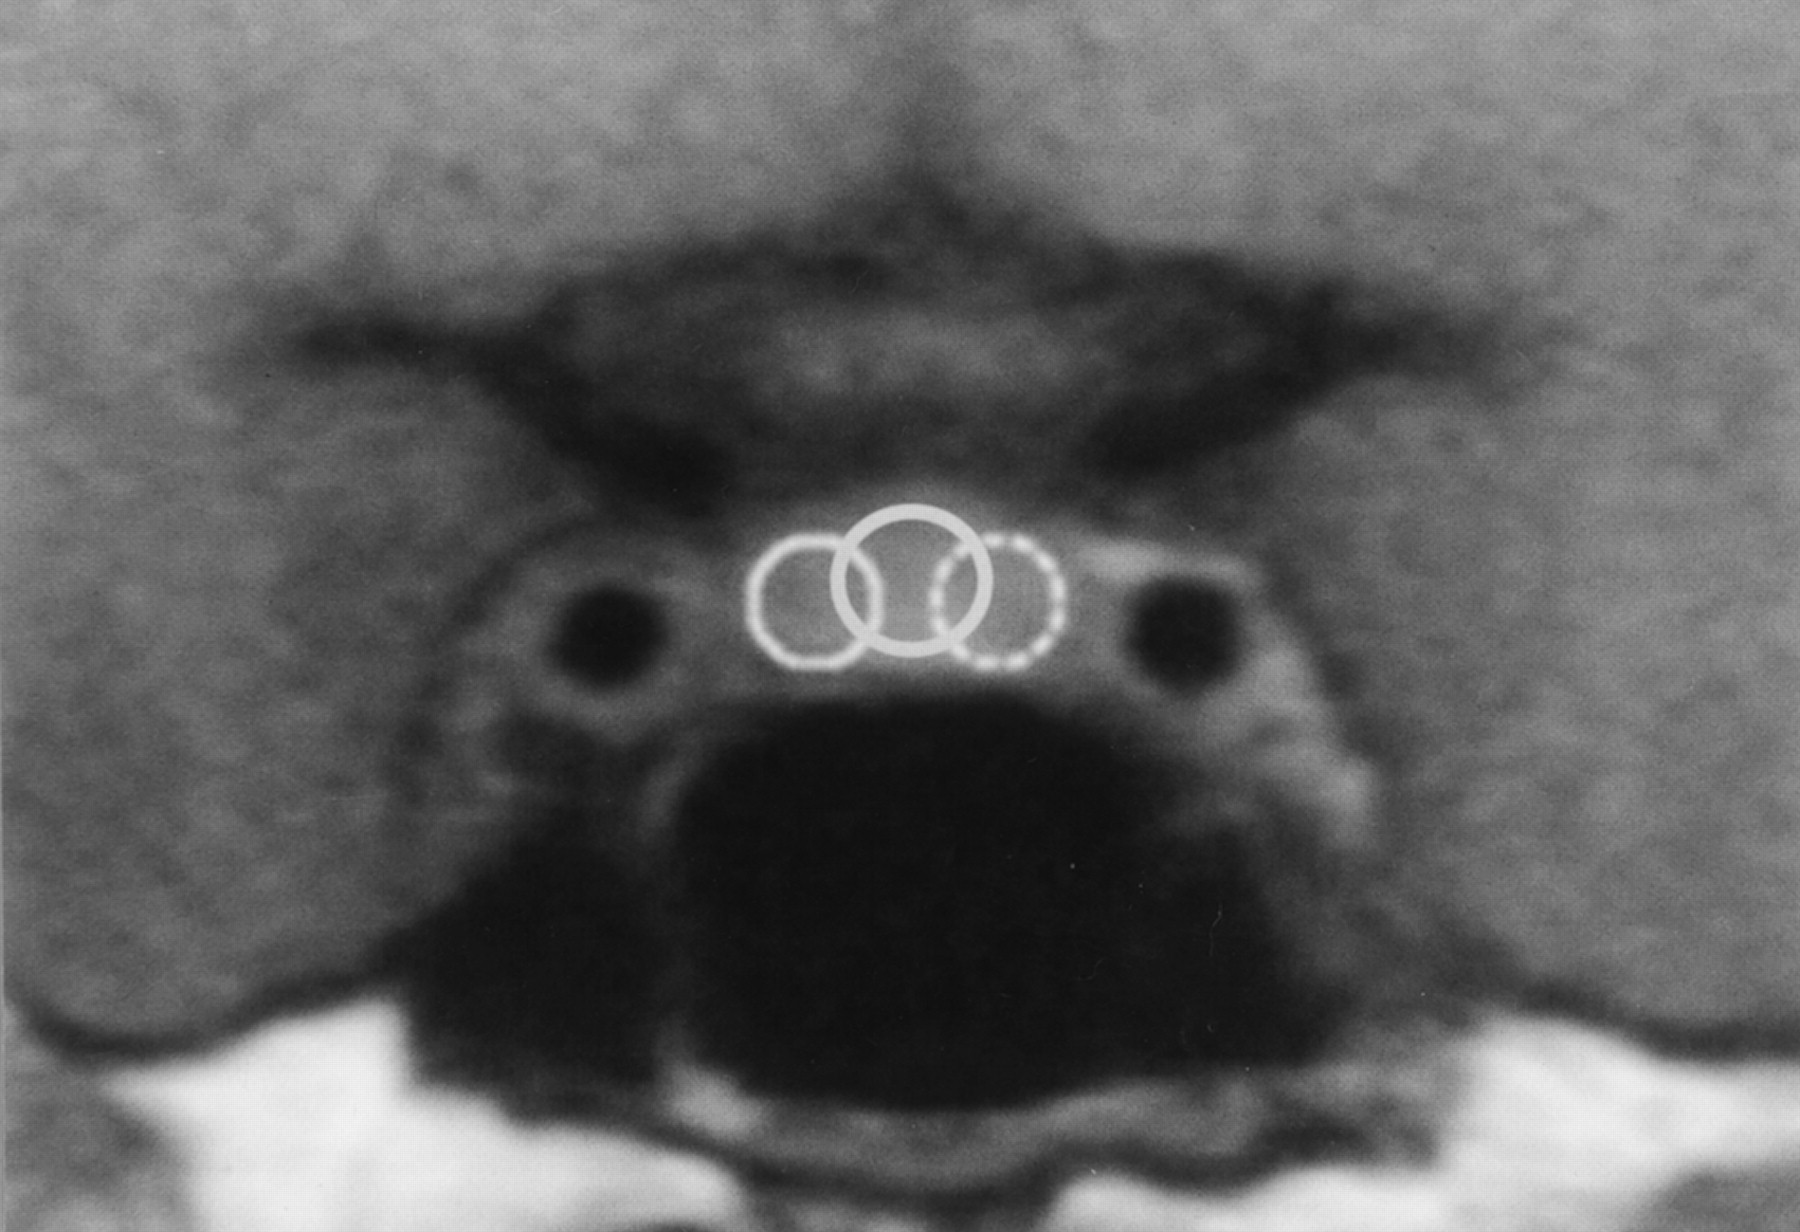
Dynamic time-intensity curves were obtained from all dynamic studies. Regions of interest (ROIs) were located at the center and bilateral peripheral areas of the anterior pituitary gland on the coronal dynamic images. The size of each ROI was determined as the maximal size within the pituitary gland, regardless of overlapping (Fig 1). The number of the phases with peak enhancement was noted for each ROI. If the peak of the dynamic curve was considered to be out of the imaging time (that is, in cases in which the measured signal intensity on the last phase of the dynamic study was the highest), the number of the last phase was noted.

ROIs on a coronal dynamic image. The ROIs were located at the center and bilateral peripheral areas of the anterior pituitary gland for dynamic curve analyses.
The dynamic MR images of the control subjects were evaluated in the same manner as in the patients. Statistical analysis between the patients and controls were performed by using the Wilcoxon signed rank test, and statistical analysis between the pretreatment images and posttreatment images were performed by using the Mann-Whitney U test.
Results
The chief complaints of the patients were conjunctival hyperemia, exophthalmos, and diplopia in seven; headache and vomiting in one; and diplopia alone in one. No patient had symptoms of hypopituitarism or other endocrine abnormalities. On the pre- and postcontrast imaging, no significant abnormality (eg, abnormal signal intensity or enlargement of the pituitary gland) was noted by the reviewers. However, statistical analysis showed a difference in the size of the pituitary gland before and after treatment (P < .05). The heights (± SD) of the pituitary gland in patients before treatment, patients after treatment, and control subjects were 6.4 mm ± 1.9, 5.0 mm ± 1.6, and 5.8 mm ± 0.8, respectively.
In contrast to the findings on the pretreatment and postcontrast images, marked abnormality was found in the evaluation of the dynamic images and curves. In the visual inspections of the early dynamic images, five cases showed laterality in the enhancement of the anterior pituitary gland (Figs 2–5, Table 2). The delayed enhancement was found on the same side as the fistula in all five cases, although in two of the five cases the fistula was bilateral. After treatment of the disease, the laterality of the enhancement completely disappeared in four cases and markedly diminished in the remaining one case (case 6, Fig 4). The mean phase (± SD) with visually homogeneous enhancement of the whole pituitary gland was 4.7 ± 2.7 before the treatment, 3.6 ±1.9 after the treatment, and 2.4 ± 0.5 for the control subjects. Statistical analysis showed a significant difference in patients before treatment and in control subjects (P <.05) and between patients before treatment and in patients after treatment (P <.05).

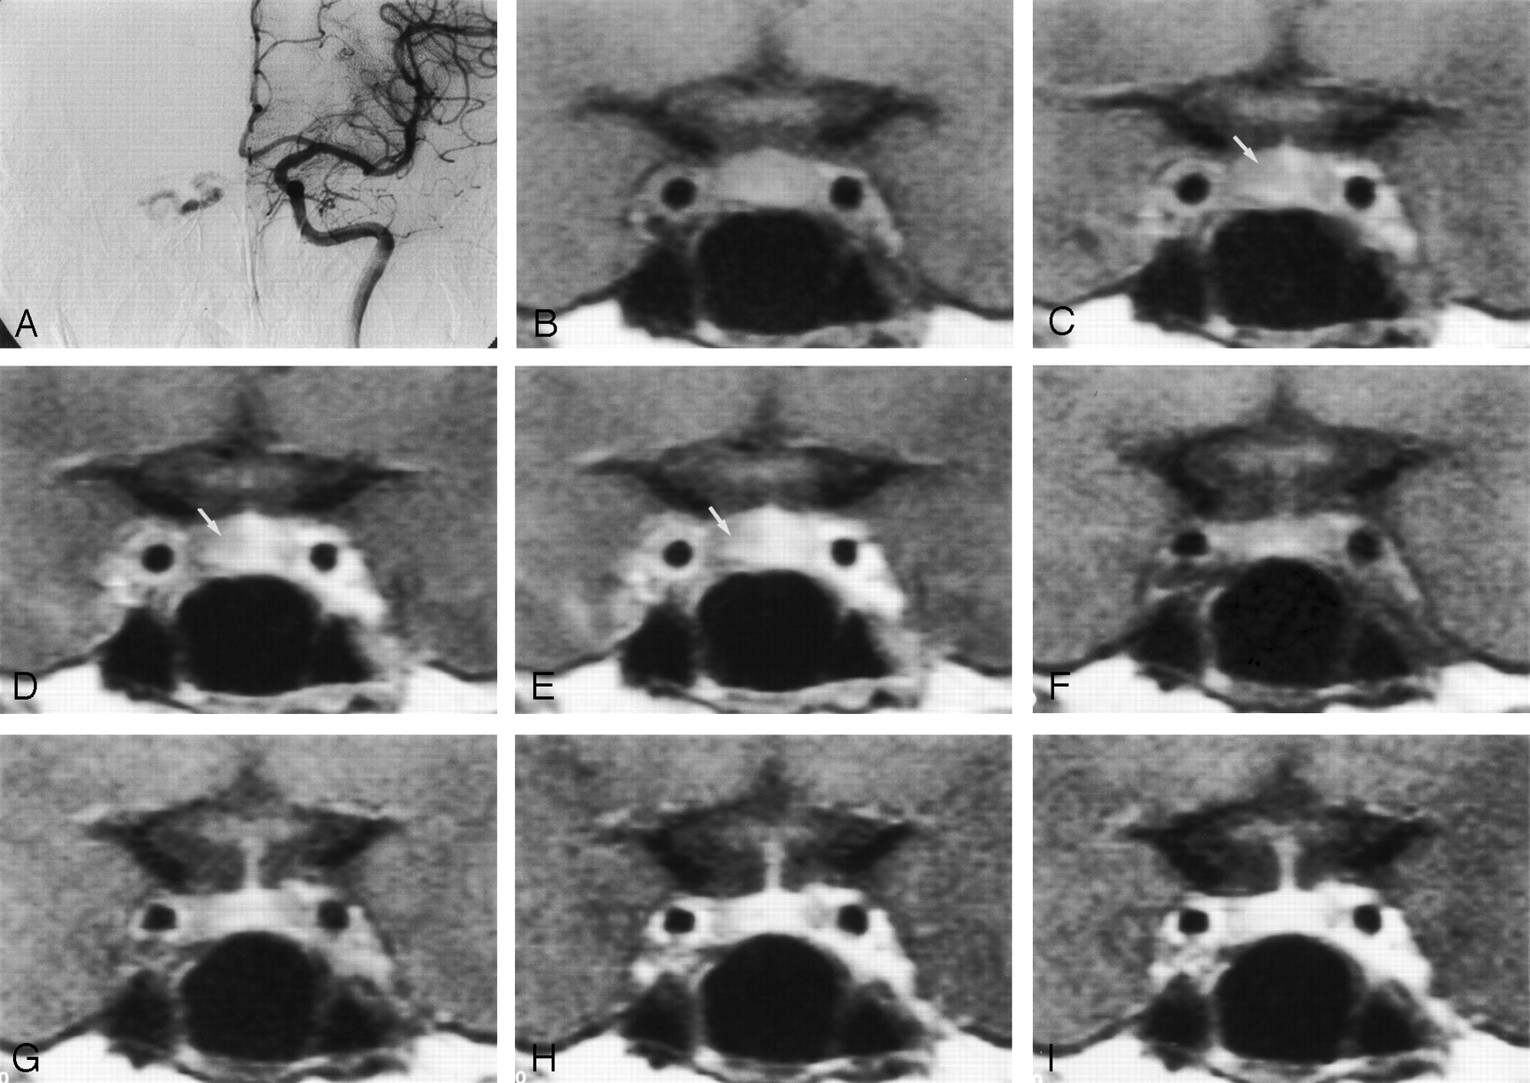
Images in a 50-year-old woman with a dural AVF draining into the right cavernous sinus (case 7).
A, Digital subtraction angiogram reveals the AVF draining into the right cavernous sinus.
B–E, Pretreatment dynamic MR images. In phase 0 (B) and in the first (C), second (D), and third (E) phases, the enhancement of the right side of the pituitary gland is delayed (arrow in C–E).
F–I, Posttreatment dynamic MR images in phase 0 (F) and in the first (G), second (H), and third (I) phases. After treatment of the disease, the pituitary gland is symmetrically enhancing on both the right and left sides, and the height of the pituitary gland decreased from 7 to 5 mm. Part of the posterior pituitary gland is seen as a hyperintense area in phase 0.

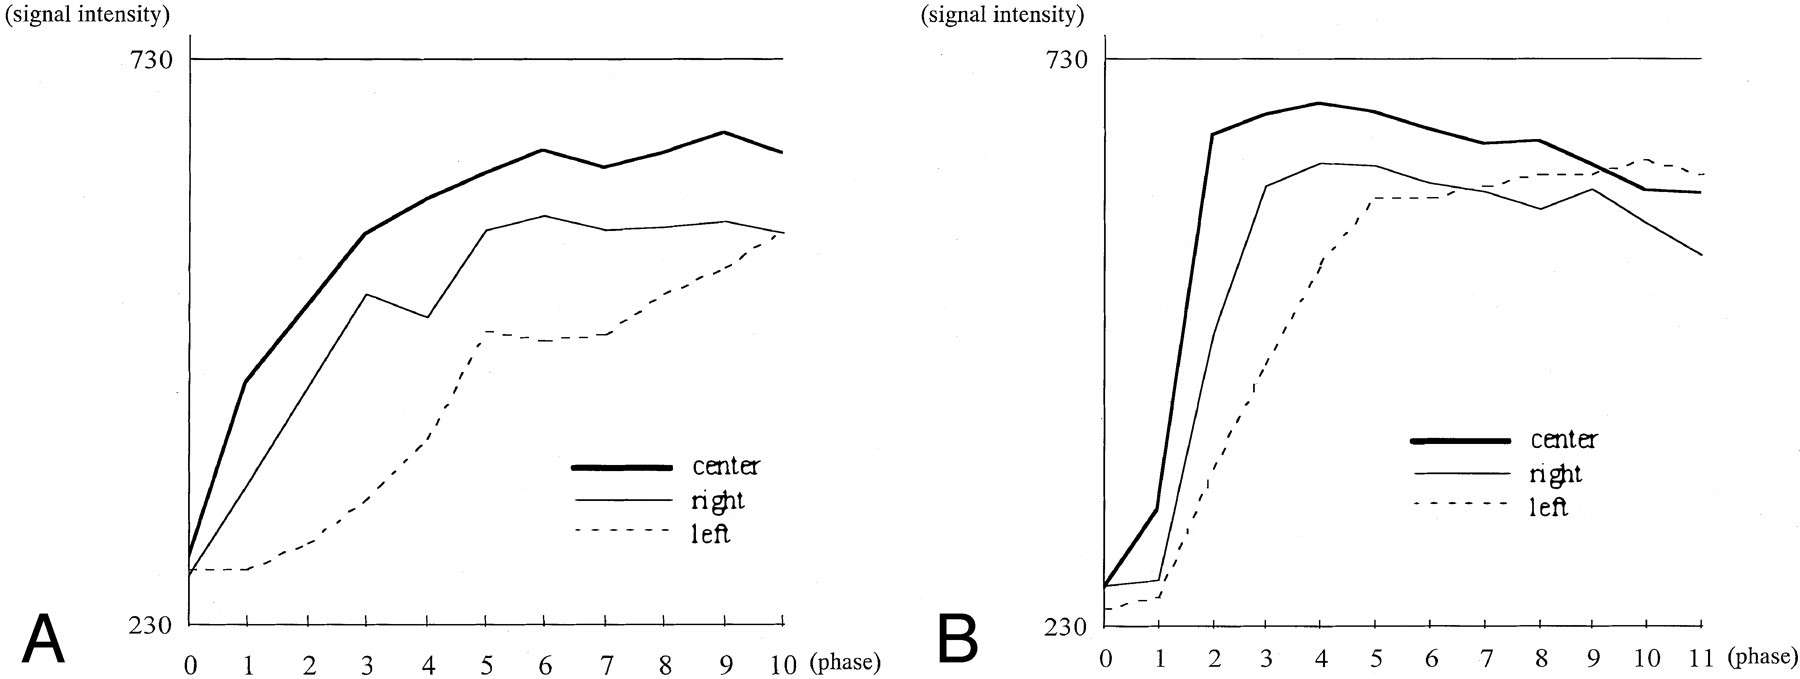
Dynamic curves in a 50-year-old woman with a dural AVF draining into the right cavernous sinus (case 7).
A, Pretreatment dynamic curves. The three ROIs were located at the center and bilateral peripheral areas of the pituitary gland (Fig 1). On the right side of the pituitary gland, the peak of the enhancement was not found within the imaging time before treatment.
B, Posttreatment dynamic curves. On the right side, the peak-enhanced phase was shortened and found within the 10 phases.

Images in a 62-year-old woman with a dural AVF draining into the left cavernous sinus (case 6).
A, Digital subtraction angiogram reveals the AVF draining into the left cavernous sinus.
B–E, Pretreatment dynamic MR images of the anterior pituitary gland. In phase 0 (B) and in the first (C), second (D), and third (E) phases, the enhancement of the left side of the pituitary gland is delayed (arrow in C–E). In phase 0, the left cavernous sinus is already enhancing because of the AVFs, but no enhancement can be seen in the pituitary gland; this is why this image was defined as phase 0.
F–I, Posttreatment dynamic MR images in phase 0 (F) and in the first (G), second (H), and third (I) phases. After treatment of the disease, the laterality of the enhancement on early dynamic images became less prominent, and the height of the pituitary gland decreased from 8 to 7 mm. In this case only, the laterality of the enhancement somewhat remained after treatment (arrow in G).

Dynamic curves in a 62-year-old woman with a dural AVF draining into the left cavernous sinus (case 6).
A, Pretreatment dynamic curves. The peaks of the dynamic curves were in phase 9 for the central area, phase 6 for the right side, and out of the imaging time for the left side.
B, Posttreatment dynamic curves. The peaks of the dynamic curves are shortened at both the central and bilateral peripheral areas of the pituitary gland.
Finding on dynamic MR images of the pituitary gland before and after therapy
A total of 27 ROIs in the patients (nine patients × center and bilateral peripheral ROIs) and 15 ROIs in the five control subjects were evaluated on the dynamic time-intensity curves (Table 3, Fig 1). The mean peak enhancement phases (± SD) at the center of the pituitary gland was 6.0 ± 1.7 before treatment and 4.2 ± 2.6 after treatment, and those of the peripheral areas of the pituitary gland were 7.5 ± 2.5 before treatment and 5.4 ± 3.1 after treatment (Table 3). Compared with the controls, the pretreatment group showed significantly delayed enhancement in the peripheral areas of the pituitary gland (P < .01). The difference was significant between the sides with the fistula in patients and control subjects and also between both sides in patients and control subjects. After treatment, the peak enhancement phase of the peripheral areas of the pituitary gland was significantly shortened (P < .01).
Peak enhancement phase on dynamic curves*
Discussion
To our knowledge, asymmetry of pituitary enhancement on dynamic MR images has not been mentioned as a feature of cavernous sinus AVF in the previous literature. No abnormality was detected on the routine (nondynamic) pre- and postcontrast MR images, other than a decrease in size after successful therapy. No pituitary dysfunction was noted, probably because of the localized venous congestion in the pituitary gland. The finding of delayed enhancement itself may not have clinical importance, as no pituitary dysfunction was noted. However, neuroradiologists and interventional neuroradiologists should be aware of this phenomenon in patients with a dural AVF in the cavernous sinus. Although we are aware of no report regarding pituitary dysfunction caused by the venous congestion, long-term exposure to the congestion or acute progression of the congestion could theoretically cause a functional disorder or hemorrhage of the pituitary gland, as seen in the venous congestion of the brain.
The unique vascular anatomy of the pituitary gland is well described in the literature (3–8). In short, the superior hypophyseal arteries indirectly supply the anterior pituitary gland through the pituitary portal system. The superior hypophyseal arteries, which arise from the supraclinoid portion of the internal carotid and posterior communicating arteries, supply the median eminence and the infundibulum, first through formation of extensive capillary networks around these structures, now called the primary portal system. The blood is then collected in vessels of various lengths within the infundibulum; these open into the vascular sinusoids within the anterior lobe of the pituitary. These sinusoids constitute the secondary plexus of the pituitary portal system, or the secondary capillary bed. The blood through the sinusoids subsequently flows into the general circulation through the cavernous sinus that surrounds the body of the pituitary gland. The lateral hypophyseal veins drain to the cavernous sinus. In contrast, the posterior pituitary lobe receives a separate and direct arterial supply from the inferior hypophyseal branch of the meningohypophyseal artery that arises directly from the cavernous portion of the internal carotid artery. The venous drainage of the posterior pituitary lobe also empties into the cavernous sinus.
Previous reports of studies with CT and MR imaging have described the sequential enhancement patterns of specific regions of the normal pituitary gland on images obtained after the bolus administration of contrast material (9–13). In 1983, Bonneville et al (9) described the pituitary tuff sign, which is the initial enhancement of the secondary portal circulation at the insertion site of the infundibulum, with progressive centrifugal enhancement of the anterior pituitary lobe. Sakamoto et al (11) used sagittal and coronal planes for dynamic MR imaging of the normal pituitary gland. They found that, on the sagittal sections, the signal intensity increased first in the posterior lobe of the pituitary gland; this was followed by enhancement of the anterior lobe adjacent to the junction with the infundibulum. On the coronal sections of the anterior lobe, the anterior pituitary lobe at the junction with the infundibulum showed earliest enhancement, the middle portion showed slightly delayed enhancement, and the lateral portion of the anterior lobe enhanced last. They also described that the washout of contrast medium from the posterior lobe was slightly faster than that from the anterior lobe. In our patients and control subjects, such sequential enhancement of the anterior pituitary lobe was also observed. Even on the sides with delayed enhancement, the progression of enhancement from central to peripheral was unchanged in the patients with cavernous sinus fistula.
Contrast enhancement of the pituitary gland depends on both the delivery of contrast material-laden blood to the region and the permeability of the local vessels to the contrast material. In this study, we visually evaluated the extent of the contrast enhancement, which represents delivery of the contrast material-laden blood into the anterior pituitary lobe. In our patients, asymmetric enhancement of the pituitary gland was visually evident on early dynamic images in five of the nine cases; the delayed enhancement was on the same side as the fistulas. Although the asymmetric enhancement was found in only five of nine patients, the pretreatment dynamic MR images showed a significant delay in the peak enhancement of the peripheral area of the anterior pituitary gland, compared with the controls. After treatment of the disease, the laterality of the pituitary enhancement completely disappeared in all patients except for one, and the peak enhancement time on dynamic imaging was shortened. Although images in case 6 showed laterality in pituitary enhancement, even after treatment, the peak enhancement time on the dynamic curve was markedly shortened after treatment. All these facts support the hypothesis that perfusion of the anterior pituitary lobe is impaired in patients with a dural AVF in the cavernous sinus; this is due to the venous congestion secondary to the increased pressure in the cavernous sinus.
Five patients were treated with a total of 30 Gy of radiation therapy. When the pituitary gland falls within the radiation field, it may lead to deficiency of the pituitary hormones (14, 15), poor growth of the pituitary gland in children (16), a reduction in weight of the pituitary gland (17), and progressive radiation-induced fibrosis (18). Functionally, growth hormone deficiency and premature sexual development can occur after doses as low as 18 Gy of fractionated radiation, and these are the most common neuroendocrine problems in children (19). In patients who receive as much as 100 Gy of radiation, a fibrotic change of the anterior pituitary gland occurs (18). However, whether irradiation of 30 Gy induces morphologic changes of the pituitary gland in adult patients is unknown. Irradiation may be one of the factors that caused the decrease in height of the pituitary gland, but the decrease in height was also found in the patients who were treated without radiation therapy. The decrease in height of the pituitary gland after embolization therapy has also been observed in a previous study (1). Other factors that may cause the change in size of the pituitary gland include the estrous cycle, which could be excluded because of the ages of the patients in this study; possible seasonal changes (20); and aging.
Clinically, dynamic MR imaging of the pituitary gland has been used mainly for the visualization of pituitary adenomas (10, 11, 13). The pituitary microadenomas are best visualized on earlier phase contrast-enhanced dynamic MR images, with a signal intensity lower than that seen on images of the normal pituitary gland (11). The laterality of the enhancement and enlargement of the pituitary gland found in our patients might mimic the finding of the pituitary microadenomas.
Limitations of this study include the differences in the manual bolus injection rates, the flow-related artifacts along the phase encoding direction on the dynamic images, and the partial-volume effects caused by the section thickness of 4 mm. Also, not all of the patients were confirmed as being cured, as determined by using conventional angiography. The rephasing gradient for arterial flow was not applied for the sequence used for the dynamic imaging, which caused flow-related artifacts along the phase encoding direction. This is one of the reasons why we did not mention the findings in the cavernous sinus into which arterial blood flows through the fistulas directly. As mentioned before, this study was primarily planned to evaluate the degree of thrombosis in the cavernous sinus in patients with cavernous AVF, both before and after therapy. However, we were disappointed with the results, because the findings in the cavernous sinus on dynamic MR images were not correlated with the angiographic findings at all. Similarly, the cavernous enhancement was not correlated with the pituitary delayed enhancement at all. For example, we saw the early cavernous enhancement in phase 0 in Figure 3, but we did not see the early enhancement in phase zero in Figure 2. We suppose that this observation is mainly because of the high velocity of the flow through the fistula into the cavernous sinus, which might appear as a flow defect or decreased signal intensity in the cavernous sinus, as is seen in the internal carotid artery on coronal dynamic images. We located the anterior pituitary lobe by its position and its nonhyperintense appearance on the T1-weighted images. Miki et al (21), however, have reported that the contrast-enhanced area of the posterior pituitary gland on early dynamic MR images exceeds the hyperintense area on T1-weighted images.
Conclusion
Five of the nine patients with a dural AVF in the cavernous sinus showed visually perceptible asymmetric contrast enhancement of the anterior pituitary gland on coronal dynamic MR imaging. The statistical analyses showed significantly delayed enhancement in the peripheral areas of the pituitary gland in the patients with before treatment. The abnormal finding was thought to be the result of impaired perfusion of the pituitary gland secondary to the increased pressure in the cavernous sinus, into which the draining veins of the pituitary gland flow. The abnormality on the dynamic images was not related to any pituitary dysfunction in this series.
References
- Received June 18, 2002.
- Accepted after revision October 8, 2002.
- Copyright © American Society of Neuroradiology
In this issue


Jump to section
Related Articles
Cited By...
- No citing articles found.