
Abstract
Summary: We herein report the case of a 15-year-old male patient with pantothenate kinase-associated neurodegeneration. The classic “eye-of-the-tiger” appearance was initially present on the globus pallidi on T2-weighted MR images and had disappeared by the time of the 10-month follow-up examination. Fluid-attenuated inversion recovery images revealed marked hypointensity in the globus pallidi and dentate nuclei and high signal intensity changes in the deep cerebral white matter. Proton MR spectroscopy revealed markedly decreased N-acetylaspartate in the globus pallidi, associated with decreased N-acetylaspartate and increased myoinositol in the deep cerebral white matter. Diffusion MR images (b=1000 s/mm2) were negative (normal appearing) for deep cerebral white matter lesions, whereas apparent diffusion coefficient values were slightly increased (1.08–1.12 × 10⁻³ mm2/s), compared with the apparent diffusion coefficient values from the normal white matter regions. Apparent diffusion coefficient values in the globus pallidi were lower than those in the unaffected thalamus.
Pantothenate kinase-associated neurodegeneration (Hallervorden-Spatz disease) is a progressive neurodegenerative disorder. It is characterized by extrapyramidal and pyramidal signs, dystonia, dysarthria, and iron accumulation in the globus pallidus and brain stem nuclei (1–6). MR imaging findings have been described (1–9); however, no previous report has dealt with diffusion MR imaging and proton MR spectroscopy in cases with this disorder. We herein present the case report of a 15-year-old male patient for whom these techniques were used.
Case Report
A 15-year-old male patient presented with tremors, dystonia, and dysarthria. He had no history of birth trauma or ischemic condition. It was noted that his development by the age of 6 years was normal; extrapyramidal and pyramidal signs and symptoms later began, and the patient eventually became unsuccessful at school. Electromyography revealed denervation manifested by slowing of lemniscal conduction over the fasciculus gracilis. Biochemistry of the blood and urine, including amino acid chromatographic analyses, were normal. Genetic examinations revealed a locus on chromosome 20p, with mutations in the gene encoding pantothenate kinase 2. The disease was identified as the classic type on the basis of clinical assessment.
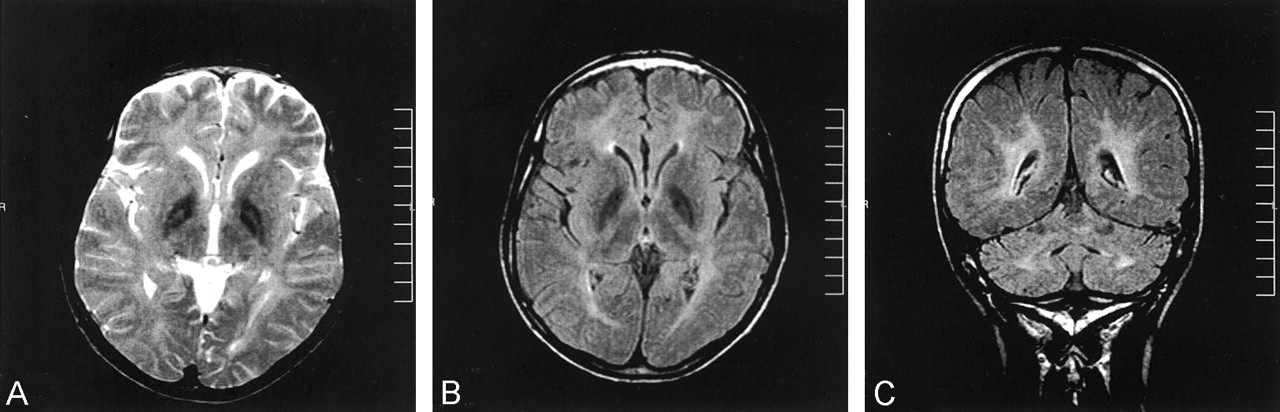
An MR imaging examination of the brain was requested and was performed on a 1.5-T imaging unit (Magnetom Vision; Siemens, Erlangen, Germany). On T2-weighted MR images, a marked hypointensity with a high signal intensity focus was evident in the globus pallidus, bilaterally, creating the characteristic eye-of-the-tiger appearance (Fig 1A). Presence of marked hypointensity of the globus pallidi was a striking finding of fluid-attenuated inversion recovery images; however, the eye-of-the-tiger appearance was not detected (Fig 1B). In addition, bilateral high signal intensity lesions were seen in the deep cerebral white matter and dentate nuclei (Fig 1C). The corpus callosum was thin. Proton MR spectroscopy was performed with hybrid chemical shift imaging. Point resolved spectroscopy (1500/40 [TR/TE]) was applied. Spectra were acquired in 100 voxels (voxel size=0.8 mL) from the brain parenchyma. Markedly decreased N-acetylaspartate (NAA) peaks were noted in the globus pallidi (Fig 2A). Decreased NAA and increased myoinositol peaks were noted in the deep cerebral white matter (Fig 2B). A normal spectrum is shown from an unaffected region in the cerebral parenchyma for comparison (Fig 2C). Changes in the metabolite peaks were revealed by ratios (NAA/creatine, NAA/choline, choline/creatine, and myoinositol/creatine) calculated from the amplitude values by using good quality spectra in 72 of 100 voxels. In the unaffected (normal appearing) regions, the mean values of the ratios were as follows: NAA/creatine=1.58, NAA/choline = 1.78, choline/creatine=0.74, and myoinositol/creatine = 0.54. In the globus pallidi, the mean values were as follows: NAA/creatine=1.16, NAA/choline=1.43, choline/creatine=1.08, and myoinositol/creatine=0.95. In the deep cerebral white matter, the mean values were as follows: NAA/creatine=1.06, NAA/choline=2.04, choline/creatine=1.82, and myoinositol/creatine=0.74.

T2-weighted and fluid-attenuated inversion recovery images from the initial examination.
A, T2-weighted image reveals marked hypointensity in the globus pallidi with high signal intensity foci (eye-of-the-tiger appearance).
B, Fluid-attenuated inversion recovery image reveals marked hypointensity of the globus pallidi. Note that the eye-of-the-tiger appearance cannot be detected.
C, Fluid-attenuated inversion recovery image reveals high signal intensity lesions in the deep cerebral white matter and dentate nuclei.

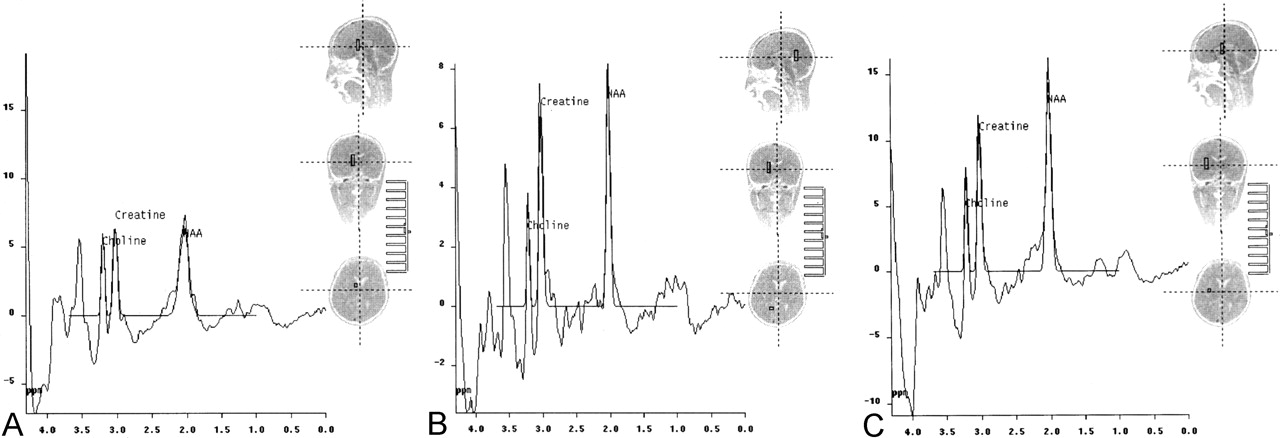
Spectra from the initial examination.
A, Proton MR spectroscopy (1500/40) reveals markedly decreased NAA in the globus pallidi.
B, Spectrum from deep cerebral white matter reveals decreased NAA and increased myoinositol peaks.
C, Spectrum from a normal region in the cerebral parenchyma.
The patient was reexamined 10 months later. His clinical status had progressed. On MR images, the globus pallidi revealed further hypointense appearance, rather homogeneous, with loss of the eye-of-the-tiger appearance (Fig 3A). Brain stem nuclei had similar changes. The high signal intensity lesions in the deep cerebral white matter and dentate nuclei were unchanged. Of diffusion MR images obtained by using an echo-planar trace sequence (5700/139; section thickness, 5 mm), b=1000 s/mm2 images revealed prominent low signal intensity changes in the globus pallidi (Fig 3B). On corresponding apparent diffusion coefficient (ADC) maps, ADC values in the globus pallidi (0.45–0.54 × 10⁻³ mm2/s) were lower than those in the unaffected thalamus (0.77–0.83 × 10⁻³ mm2/s) (Fig 3C). For deep cerebral white matter lesions, b=1000 s/mm2 images were negative (normal appearing) (Fig 3D) whereas ADC maps revealed slightly increased ADC values (1.08–1.12 × 10⁻³ mm2/s) compared with the ADC values from the normal white matter regions (0.78–0.87 × 10⁻³ mm2/s) (Fig 3E).

Images obtained at the 10-month follow-up examination.
A, T2-weighted image reveals further hypointense appearance of the globus pallidi. Note loss of the eye-of-the-tiger appearance.
B, b=1000 s/mm2 image from trace diffusion MR imaging sequence (5700/139) reveals low signal intensity in the globus pallidi.
C, Corresponding ADC map (same section as that shown in B) reveals low ADC values (0.45–0.54 × 10⁻³ mm2/s) in the globus pallidi, compared with the unaffected thalamus (0.77 to 0.83 × 10⁻³ mm2/s).
D, b=1000 s/mm2 image is negative (normal appearing) for the deep cerebral white matter lesions.
E, Corresponding ADC map (same section as that shown in D) reveals slightly increased ADC values (1.08–1.12 × 10⁻³ mm2/s) compared with the ADC values from the normal white matter regions (0.78–0.87 × 10⁻³ mm2/s).
Discussion
It has been reported that Hallervorden-Spatz syndrome has two forms, based on clinical assessment: classic disease with early onset and rapid progression and atypical disease with later onset and slow progression. All patients with the classic disease and approximately one-third of those with atypical disease have pantothenate kinase 2 mutations (8). The patient whose case is reported herein had the classic disease, based on clinical assessment. The most characteristic MR imaging finding is presence of bilateral diffuse low signal intensity of the globus pallidus, which includes a focus of high signal intensity on T2-weighted images. This creates the so-called eye-of-the-tiger appearance (1–6). Histopathologic studies have revealed that low signal intensity is due to iron deposition and that high signal intensity of the eye-of-the-tiger sign corresponds to an area of vacuolization (spheroid formation) of the axons (1). Other findings include neuronal loss, axonal swelling, and gliosis (1–6). Regarding the MR imaging findings for the patient whose case is presented herein, the classic eye-of-the-tiger appearance was clearly seen on the initial T2-weighted MR images and it was interesting to note that it had disappeared by the time of the 10-month follow-up examination. This can reflect more iron deposition in the globus pallidi, with resultant dominance of the iron signal intensity on MR images. On the other hand, it was interesting that unlike previous patients with the syndrome, this patient had bilateral high signal intensity lesions in the deep cerebral white matter and in the dentate nuclei, best appreciated on fluid-attenuated inversion recovery images. This appearance had remained unchanged at the 10-month follow-up examination. The other interesting MR imaging finding was existence of marked low signal intensity in the globus pallidi on the fluid-attenuated inversion recovery images. It is known that fluid-attenuated inversion recovery imaging is relatively less sensitive to susceptibility effects, such as iron deposition and hemorrhage; therefore, it is likely that the presence of marked low signal intensity in the globus pallidi in this patient was a further indicator of presence of the disease. However, it should be noted that the eye-of-the-tiger appearance cannot be detected on fluid-attenuated inversion recovery images.
It is likely that the proton MR spectroscopy finding of markedly decreased NAA in the globus pallidi mainly represented neuronal loss in that region, considering that NAA is a neuronal marker (10). Whether the decreased NAA and increased myoinositol peaks in the deep cerebral white matter reflected glial proliferation requires further evaluation. On the other hand, the diffusion MR imaging finding in the globus pallidi at the 10-month follow-up examination was the presence of low signal intensity changes associated with lower ADC values than those of the unaffected thalamus. No evidence was found of eye-of-the-tiger appearance on diffusion MR images obtained at that stage, which was in accordance with T2-weighted images that indicated this sign had already disappeared. A recent report dealt with echo-planar diffusion MR imaging of normal brain iron in the globus pallidus in 20 cases, which showed that the globus pallidus appeared hypointense on b=1000 s/mm2 images, compared with the surrounding parenchymal structures (11). The mean ADC value was low in the globus pallidus (0.48 ± 0.12 × 10⁻³ mm2/s), compared with the normal cerebral parenchyma (0.85 ± 0.11 × 10⁻³ mm2/s) (11). For that patient, although b=1000 s/mm2 images revealed prominent hypointensity in the globus pallidi, the ADC values were similar to those of the previously reported normal cases (11). Therefore, diffusion MR imaging seems to show nonspecific changes for the regions of iron deposition in the syndrome. On the other hand, b=1000 s/mm2 images were negative (normal appearing) for deep cerebral white matter lesions, whereas ADC values were increased compared with ADC values from the normal white matter regions. The significance of this elevated diffusion MR imaging pattern in the deep cerebral white matter requires further evaluation.
References
- Received January 16, 2003.
- Accepted after revision March 11, 2003.
- Copyright © American Society of Neuroradiology
In this issue


Jump to section
Related Articles
Cited By...
- No citing articles found.