
Abstract
BACKGROUND AND PURPOSE: The assessment of patients with temporal lobe epilepsy (TLE) traditionally focuses on the hippocampal formation. These patients, however, may present structural abnormalities in other brain areas. Our purpose was to develop a method to measure the combined volume of the human piriform cortex and cortical amygdala (PCA) by using MR imaging and to investigate PCA atrophy.
METHODS: The definition of anatomic landmarks on MR images was based on histologic analysis of 23 autopsy control subjects. Thirty-nine adults with chronic TLE and 23 age-matched control subjects were studied. All underwent high-spatial-resolution MR imaging at 1.5T, including a tilted T1-weighted 3D dataset. The PCA volumes were compared with the control values and further correlated with hippocampal, amygdale, and entorhinal cortex volumes.
RESULTS: The normal volume was 530 ± 59 mm3 (422–644) [mean ± 1 SD (range)] on the right and 512 ± 60 mm3 (406–610) on the left PCA (no asymmetry, and no age or sex effect). The intraobserver and interobserver variability were 6% and 8%, respectively. In right TLE patients, the mean right PCA volume was 18% smaller than in control subjects (P < .001) and 15% smaller than in left TLE (P < .001). In left TLE, the mean left PCA volume was 16% smaller than in control subjects (P < .001) and 19% smaller than in right TLE (P < .001). Overall, 46% (18/39) of the patients had a greater than 20% volume reduction in the ipsilateral PCA. There was bilateral atrophy in 18% (7/39). Patients with hippocampal volumes of at least 2 SDs below the control mean had an 18% reduction in the mean PCA volume compared with patients without hippocampal atrophy (P < .001). Ipsilaterally, hippocampal (r = 0.756, P < .01), amygdaloid (r = 0.548, P < .01), and entorhinal (r = 0.500, P < .01) volumes correlated with the PCA volumes.
CONCLUSION: The quantification of PCA volume with MR imaging showed that the PCA is extensively damaged in chronic TLE patients, particularly in those with hippocampal atrophy.
Temporal lobe epilepsy (TLE) is a localization-related epilepsy with typical clinical and electroencephalographic characteristics (1, 2). Complex partial seizures originating from the temporal lobe are the single most common type of focal-onset seizure encountered in the adult population (3, 4).
One of the histopathologic landmarks of TLE (5) is hippocampal sclerosis (HS), present in up to 90% of surgically treated drug-refractory patients (6). Tissue damage to temporal lobe structures other than the hippocampus, including the amygdaloid complex and the adjacent entorhinal, perirhinal, and parahippocampal cortices, contributes to a lowered seizure threshold, seizure spread, and cognitive decline in TLE (7–14).
An additional mesio-temporal region that may be involved in the physiopathologic findings of TLE comprises the piriform and periamygdaloid cortices. These structures share with the hippocampus an allocortical organization (15) and are core elements of the limbic system.
The piriform cortex (PC) is an olfactory-related, small region located rostromedial to the amygdala, overlying the fundus of the endorhinal sulcus. It receives primary olfactory projections from the olfactory bulb, as well as from other olfactory structures such as the anterior olfactory nucleus, sends projections to different limbic structures such as the entorhinal cortex (16–18), and is a major recipient of sensory afferents, but additional targets also comprise the periamygdaloid and the entorhinal areas. The efferent circuitry from the PC terminates mainly in the neighboring periamygdaloid cortex (PAC) and in the anterior and posterior cortical amygdala nuclei (19). Additionally, the PC, PAC and cortical amygdala nuclei share a similar functional processing of sensory-evoked activity (20) and therefore can be grouped as a PC-cortical amygdala area.
The PC has received little attention in human epilepsy studies (21), although it has a critical role in the generation of epileptogenic and ictogenic networks in experimental TLE (22, 23).
A number of studies carried out in animal models of TLE demonstrated that the PC is activated early during focal seizure activity. For example, studies by using c-Fos immunohistochemistry (24, 25) or deoxy-glucose autoradiography (26) indicate that the PC becomes activated and damaged during the first hour after the initiation of prolonged seizure activity (24, 27). If status epilepticus is not stopped, neuronal loss becomes more severe and extensive (28–30). Consistent with histologic observations, MR imaging studies of rat tissue ex vivo after SE demonstrate that the PC is one of the most sensitive areas to damage caused by prolonged focal seizure activity (31, 32). Moreover, PC damage is associated with the development of spontaneous focal-onset seizures after SE (33).
The PC is also prone to activity-dependent plasticity. In studies of the kindling model of TLE, the PC is easier to kindle than the amygdala, hippocampus, or adjacent cortex (34–36). Further, the PC is a critical generator of seizure activity within the temporal lobe as spontaneous interictal discharges first appear in the PC in the kindled brain (37) before they spread to other brain areas (35, 38). In particular, the area tempestas (39), which is a small region located in the piriform cortex, is proposed to have a pivotal role in seizure spread in rodents (40, 41) and in nonhuman primates (42). Finally, the PC and PAC plus the adjacent cortical amygdaloid nuclei are key areas for processing olfactory information (18, 43).
Based on previous studies, olfactory sensations are not uncommon as an early sign of seizure onset in patients with TLE, particularly if the primary focus is in the amygdala (44), which is probably related to the heavy interconnections between the cortical amygdaloid nuclei and the PC (rodents: [45, 46]; primates: [47]). Together, these data suggest a role for the PC in ictogenesis as well as in the symptomatology of TLE. To date, however, there have been no attempts to investigate the contribution of piriform and cortical amygdala (PCA) atrophy to the human TLE syndrome.
We hypothesized that the piriform and cortical amygdala is damaged in a subpopulation of patients and, further, it is most damaged in patients with lesions in other temporal lobe structures (e.g., amygdala, hippocampus, entorhinal cortex). Therefore, we first defined the anatomic landmarks of the PCA in histologic sections of control brains as a guide for identification of the PCA in coronal MR images. We then investigated the occurrence of PCA damage by quantifying the degree of atrophy as well as its association with the volumes of hippocampus, amygdala, and entorhinal cortex in patients with chronic TLE. Part of this work was published in abstract form (48).
Methods
Subjects and Tissue Preparation for Histologic Examination
Twenty-three temporal lobes from 21 cases (two cases had both hemispheres studied) from a series of 44 autopsies were analyzed (12 men, nine women; mean age, 41 ± 14 years; range, 16–65 years). All the subjects were reported as clinically neurologically normal at the time of death. All cases had coronal sections cut perpendicular to the line between the anterior and posterior commissures and covered the entire PCA area. The right hemisphere was available for study in 14 cases and the left in nine cases. No differences were observed in the lamination, subfields, or topographic relation between the piriform and adjacent perirhinal and periamygdaloid cortices and amygdalo-hippocampal transitional area between the left and right hemispheres. All cases were determined neuropathologically normal, thus excluding abnormalities of the central nervous system that could impair the identification of the cytoarchitectonic boundaries.
Protocols for fixation, cryoprotection, cutting, and storage of human brain were performed as described previously (49) and the cytoarchitectonic analysis followed the methodology of Insausti et al (50). Sections were spaced 250 μm, and every eighth section was analyzed, that is, with an interval of one-half mm.
The piriform and periamygdaloid cortices areas were grouped together (PCA) first because they are closely related both anatomically and functionally (15, 18–20, 43). The periamygdaloid cortex (PAC) is located underneath the PC in the rostral medial temporal lobe and is made up of five subfields (PAC0, PAC1, PAC2, PAC3, PACS). The PC originates a great number of associational projections to other olfactory and cortical structures. Furthermore, the PC and PAC grouped together offered a more sizeable amount of tissue to be determined volumetrically.
A volume was estimated by using the Cavalieri method, an unbiased stereological procedure that allows an efficient and precise estimation of the volume of a structure of arbitrary size and shape through a series of parallel planes of the structure spaced at a constant distance (51, 52). Applying a test point graticule on the PCA regions and counting those test points hitting the PCA region, we obtained the unbiased estimate of volume of the PCA [estV(PCA)] according to the following equation,  where P1, P2,…, Pn denote the number of test points hitting PCA on each consecutive section, t is the sectioning interval for the n consecutive sections, and a/p is the area associated with each test point (in our study, t = 0.5 mm. and a/p = .49 mm2). We estimated that about 6% of the PCA sections were lost (damage, interval between blocks, etc.), and the quantification could not be made by interpolation of previous and following sections.
The precision of the volume estimates when using the Cavalieri method and the point counting method was assessed by the equation (53),  where Ā and B̄ denote the mean transect area and boundary length respectively. The estimation of the B̄/
 is a shape coefficient that measures the shape of the PCA profiles through the sections. Shape coefficient was measured in all cases despite the great stability of it. The range of values between different samples was 4.8–5.4 with a mean of 5.1.
The contribution of the point counting to overall estimation of the CE (estV) is, in general, negligible compared with the contribution of differences between sections. The study includes the estimation of the contribution of the point counting to the precision of the Cavalieri estimate of volume of the PCA according to the following equation, 
Thus, the contribution to the overall CE due to the variation between section areas of the PCA can be predicted from the equation,  where subscript s and t means section and total respectively.
MR Imaging
Subjects for MR Imaging.
The control group included 23 healthy individuals (11 men, 12 women), with a mean age of 32 ± 10 years (mean ± 1 SD; range: 21 –52 years) who were interviewed to exclude any neurologic or psychiatric diseases.
The patient group included 39 adults (17 men, 22 women) with chronic TLE, evaluated at the Department of Neurology at the Kuopio University Hospital in Finland. Only patients that did not have any identified etiology underlying their epileptic disorder were chosen to minimize the contribution of various etiologic factors to the cortical atrophy. Diagnosis of TLE was established on the basis of medical history, neurologic examination, electroencephalography (EEG), and qualitative MR imaging, including high-resolution T1- and T2-weighted, proton attenuation, inversion-recovery, and fluid-attenuation inversion recovery scans. Seizure symptomatology and noninvasive EEG data were used to determine the laterality of TLE. On the basis of EEG recordings, 18 patients had TLE with a unilateral seizure focus on the right and 21 patients had a seizure focus on the left. At the time of the MR image, the mean age of the patient group was 34 ± 9 years (range: 16–53 years). Total lifetime seizure number was calculated as described previously (54).
MR Image Acquisition.
Patients and control individuals underwent imaging on a 1.5T Magnetom (Siemens, Erlangen, Germany) by using a standard head coil and a tilted coronal 3D magnetization-prepared rapid acquisition gradient-echo sequence with the following parameters: (TR/TE/NEX), 10/4/1; inversion time, 250 ms; flip angle, 12°; FOV, 250 mm; matrix, 256 × 192. This resulted in 124–128 contiguous T1-weighted images with a 1.5- to 2.0-mm section thickness oriented perpendicular to the long hippocampal axis, which were further reconstructed to 2.0-mm-thick contiguous sections oriented perpendicular to the line drawn between the anterior and posterior commissures at the individual midsagittal level (similar to the histologic plane of section). Consequently, the reconstructed MR images and the histologic sections had an identical in-plane orientation and spacing, which facilitated the identification of the anatomic boundaries. Using a different in-plane orientation on MR imaging would make the histologic boundaries difficult to reproduce and another MR imaging section thickness would impair the definition and contrast of the images (if less than 2.0-mm-thick) or enhance the partial volume effects (if larger than 2.0-mm-thick). According to the histologically defined landmarks, the boundaries of the PCA were drawn manually by using a trackball-driven cursor.
To minimize the effect of a possible bias, the cases were analyzed in random order without knowledge of the side of the epileptic focus.
The volumetric analysis of the hippocampus (55), amygdala (7) and entorhinal cortex (54), from these cases was previously reported (see Table 1 for a brief description of the results).
Normalized volumes and asymmetry ratios of the right and left hippocampus, amygdala complex and entorhinal cortex
Definition of the PC and Cortical Amygdala Borders in Histologic Sections
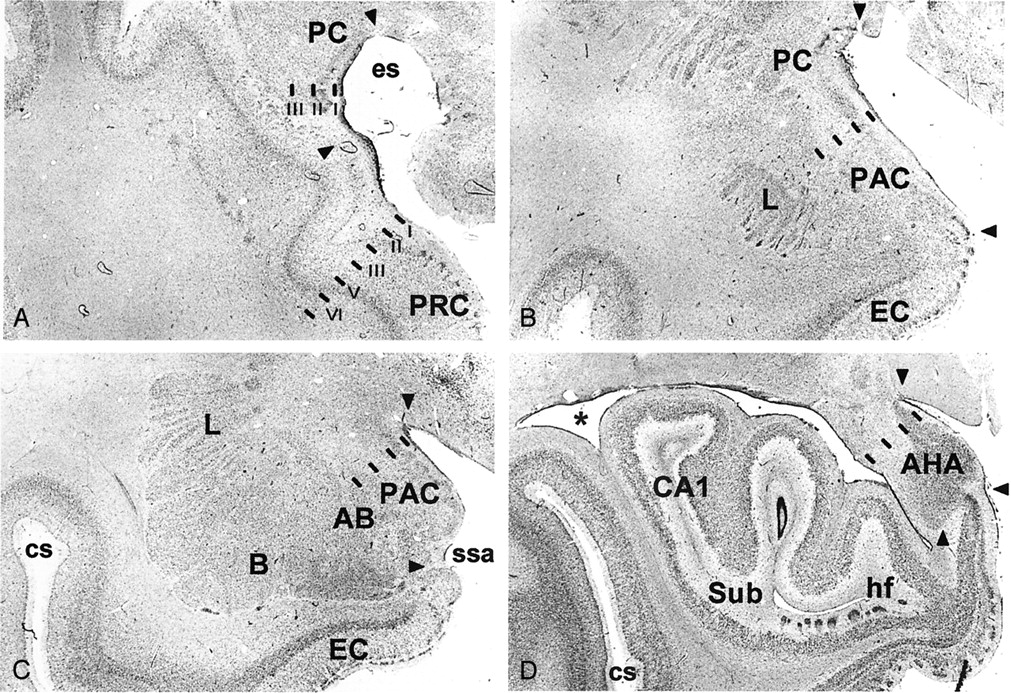
The histologic appearance and location of the PC (area 51 of Brodmann [56]), the cortical amygdaloid nuclei including the anterior cortical nucleus, medial nucleus, and periamygdaloid cortex, as well as the amygdalo-hippocampal area are shown in Figure 1 (for nomenclature of the human amygdala, see [57]). Together they form a ribbon located around the limen insulae and share a common trilaminated structure (58–61) that defines the paleocortex. Next, we describe the major anatomic landmarks used to identify each of these cortical regions in a rostral to caudal direction (Fig 2).

Brightfield photomicrographs of thionin-stained sections on the coronal plane show cytoarchitectonic borders (arrowheads) of the different components of the piriform cortex-cortical amygdala (PCA) region as defined in the present study. A is the most rostal (at the level of the limen insulae) and D is the most caudal (hippocampal head). PC indicates piriform cortex; PRC, perirhinal cortex; es, endorhinal sulcus; PAC, periamygdaloid cortex; L, amygdala lateral nucleus; EC, entorhinal cortex; AB, amygdala accessory basal nucleus; B, amygdala basal nucleus; ssa, sulcus semiannularis; cs, colateral sulcus; AHA, amygdalo-hippocampal area; CA1, hippocampal field 1; Sub, subiculum; hf, hippocampal fissure; asterisk, lateral ventricle. Scale bar equals 2 mm.

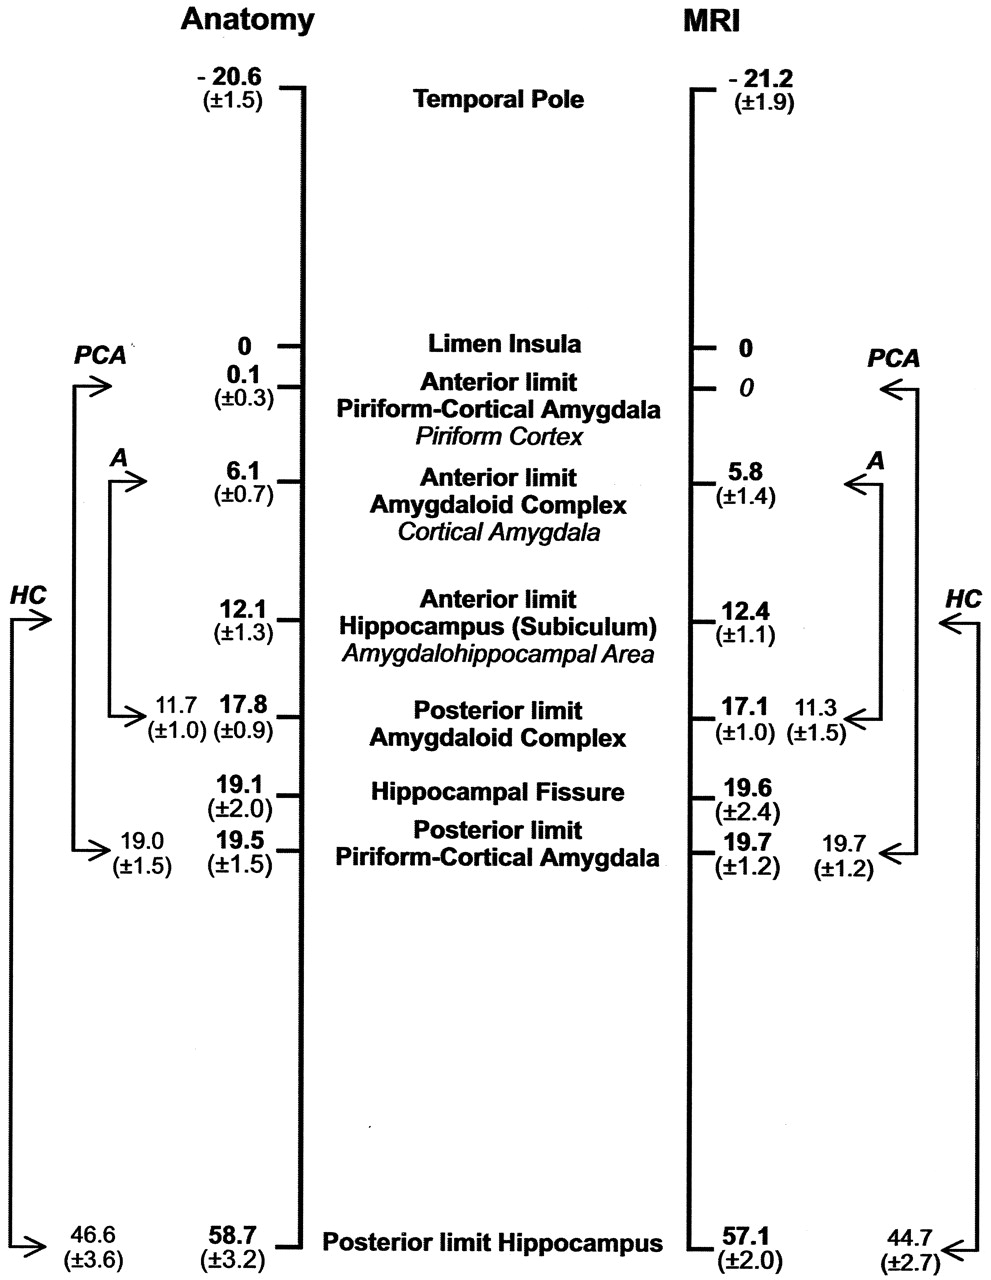
Schematic representation of the rostrocaudal location and extent of the major landmarks relative to the limen insula (set at 0) used to define the PCA. Numbers on the left (mean distance in millimeters ± SD) were calculated from control histologic cases (23 temporal lobes) and on the right from the MR imaging control group (46 temporal lobes). The values between arrows depict the mean (± 1 SD) distances between the rostro-caudal limits of the PCA, the amygdaloid complex (A), and the hippocampus (HC).
Piriform Cortex.
The most rostral aspect of the PC is located in the caudolateral portion of the orbitofrontal cortex where it is situated lateral and ventral to the lateral olfactory tract. From there, it extends to the dorsal medial temporal lobe where its major portion is located, and terminates in the periamygdaloid region where it fuses with the cortical amygdala. In Nissl preparations, the PC has a characteristic prominent S-shape, due to a cell-sparse layer I and densely packed layer II that is composed of large pyramidal cells. Deep to layer II lies a thicker and less-densely packed layer III of slightly larger pyramidal cells (Fig 1A).
Although the boundaries of the PC can be easily identified from the adjacent cortices in Nissl-stained histologic sections, there are no clues to outline its borders on correspondent MR images, particularly in the frontal lobe. Therefore, to obtain a more reliable estimate of the PC volume, we focused on the temporal extension of the PC. Based on histologic assessment, the frontal aspect of the PC forms a fairly minor portion of the PC (10–15% of the total PC volume)(47). There are also no landmarks for placing the border between the PC and the cortical amygdaloid nuclei (the anterior cortical nucleus). Therefore, the neighboring cortical amygdala and the amygdalo-hippocampal area were included in the analysis. The region of volume measurement was the PCA and includes the PC located in the temporal lobe, anterior cortical nucleus of the amygdala, medial nucleus of the amygdala, nucleus of the lateral olfactory tract, periamygdaloid cortex (PAC0, PAC1, PAC2, PAC3 and PACS subfields), posterior cortical nucleus of the amygdala, and the amygdalo-hippocampal area (Fig 1).
Histologic analysis of 23 hemispheres demonstrated that the PC in the temporal lobe begins at the level of the limen insulae (LI, or frontotemporal junction, formed at the junction between the frontal and temporal lobes) in 21 of 23 cases (Figs 3and 4A). In two cases, the rostral border of the PC was approximately 1 mm rostral to the LI. Therefore, the coronal MR imaging section containing the LI was demarcated as the section containing the most rostral portion of the PC (Fig 5). At this level, the dorsal border of the PC was drawn at the fundus of the endorhinal sulcus (Figs 1A and 5). In histologic sections, the mediolateral extent of the PC occupies approximately 30% of the distance from the convexity of the rostralmost portion of the gyrus semilunaris (the most medial prominence of the medial temporal lobe) (Fig 5) to the fundus of the endorhinal sulcus (Fig 5). From this level caudally, and as far as the rostral limit of the amygdala, the PC occupied progressively a larger proportion of the gray matter on the medial aspect of the medial temporal lobe, up to 80% on the section immediately anterior to the begining of the amygdala (Fig 5). The most caudal section where the PC is present is located approximately 6 mm caudal to the LI (Fig 5). At this level, its mediolateral extent is highly variable and no larger than 20% of the total distance between the fundus and the gyrus semilunaris. Here, the cortical amygdala occupies most of the dorsal surface of the medial temporal lobe. In histologic sections, the thickness of the PC reaches 1 mm throughout its full rostro-caudal extent. Because the thickness of the adjacent perirhinal cortex is 4 mm, the thickness of the PC can be estimated to be one-fourth (25%) that of the perirhinal cortex in coronal MR images.

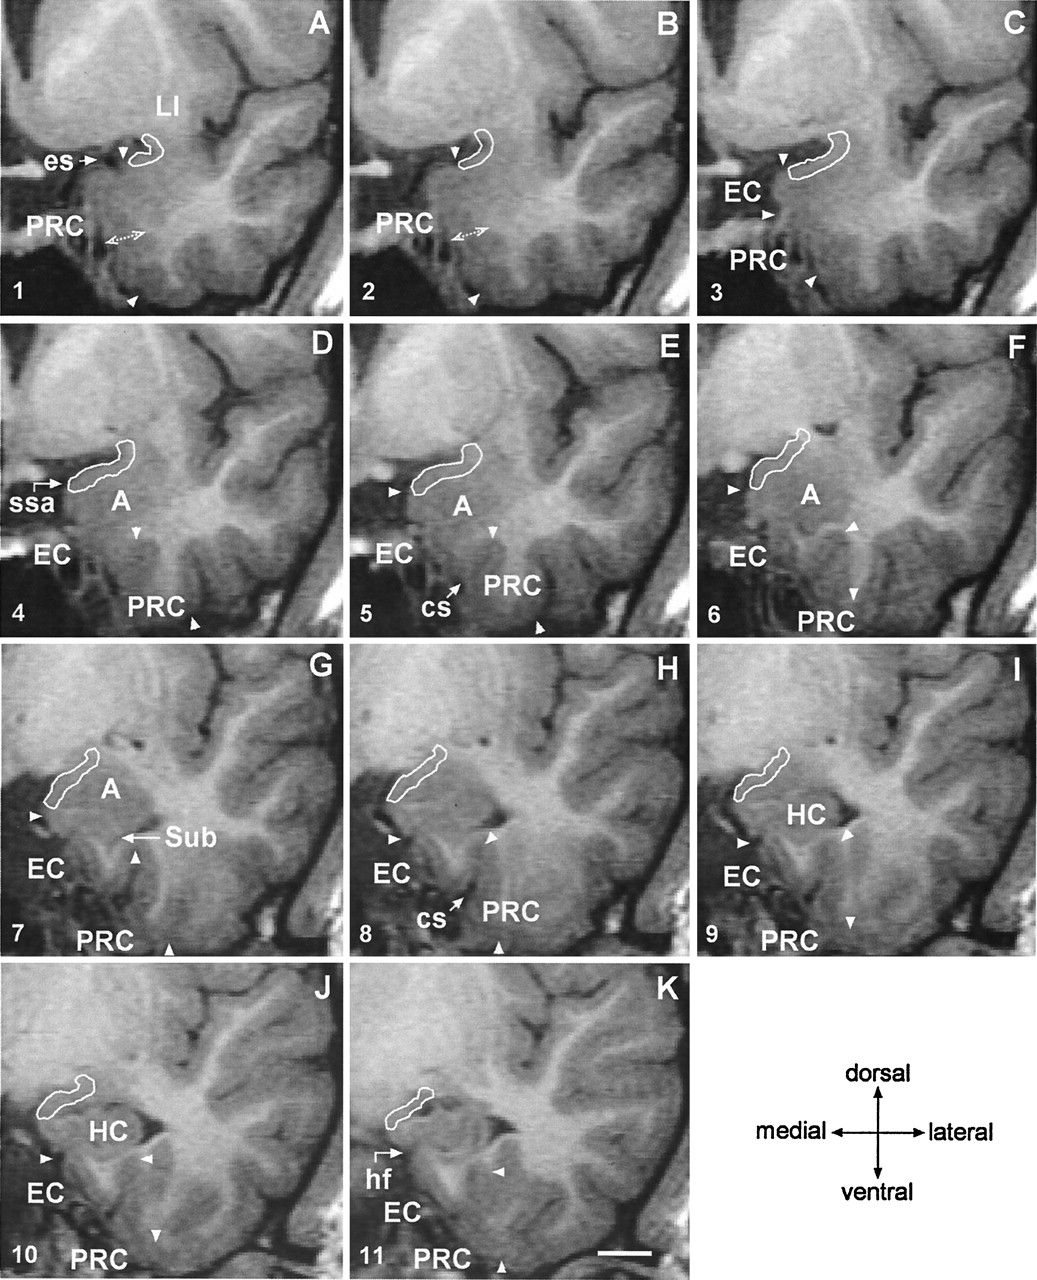
Successive 2-mm coronal MR images demonstrate the location of the PCA. A is the most rostral and F is the most caudal. A, Shows the limen insulae (LI); B, first section where the characteristic ovoid shape of the amygdala (A) can be recognized; C, full extent of the amygdala (A) with lateral ventricle appearing underneath (asterisk); D, appearance of the rostral hippocampus (HC); E, rostral hippocampus at the level of the hippocampal head and lateral ventricle (asterisk); and F, hippocampal fissure (hf; arrow). Scale bar equals 20 mm (applies to all panels).

Coronal 2-mm-thick MR images from a control subject demonstrate the outline of the PCA at different rostrocaudal levels. Line drawings of the same MR imaging sections demonstrating more anatomic details are shown in Figure 5 (numbers in the lower left corner correspond to the levels of the line-drawings). A is the most rostral and K is the most caudal. In panels A and B, the thickness of the perirhinal cortex, which serves as reference for the thickness of the PCA is indicated. Panel C marks the anterior-most limit of the entorhinal cortex. In panels D, E and F, the characteristic ovoid shape of the amygdala can be recognized. Panel G shows the appearance of the subiculum. Panels H–K show the hippocampal head. EC indicates entorhinal cortex; cs, colateral sulcus (arrow); A, amygdala; es, endorhinal sulcus (arrow); HC, hippocampus; hf, hippocampal fissure (arrow); LI, limen insulae; PRC, perirhinal cortex; ssa, sulcus semiannularis (arrow); Sub, subiculum; and arrowheads, boundaries of the entorhinal and perirhinal cortices. Scale bar equals 10 mm (applies to all panels).

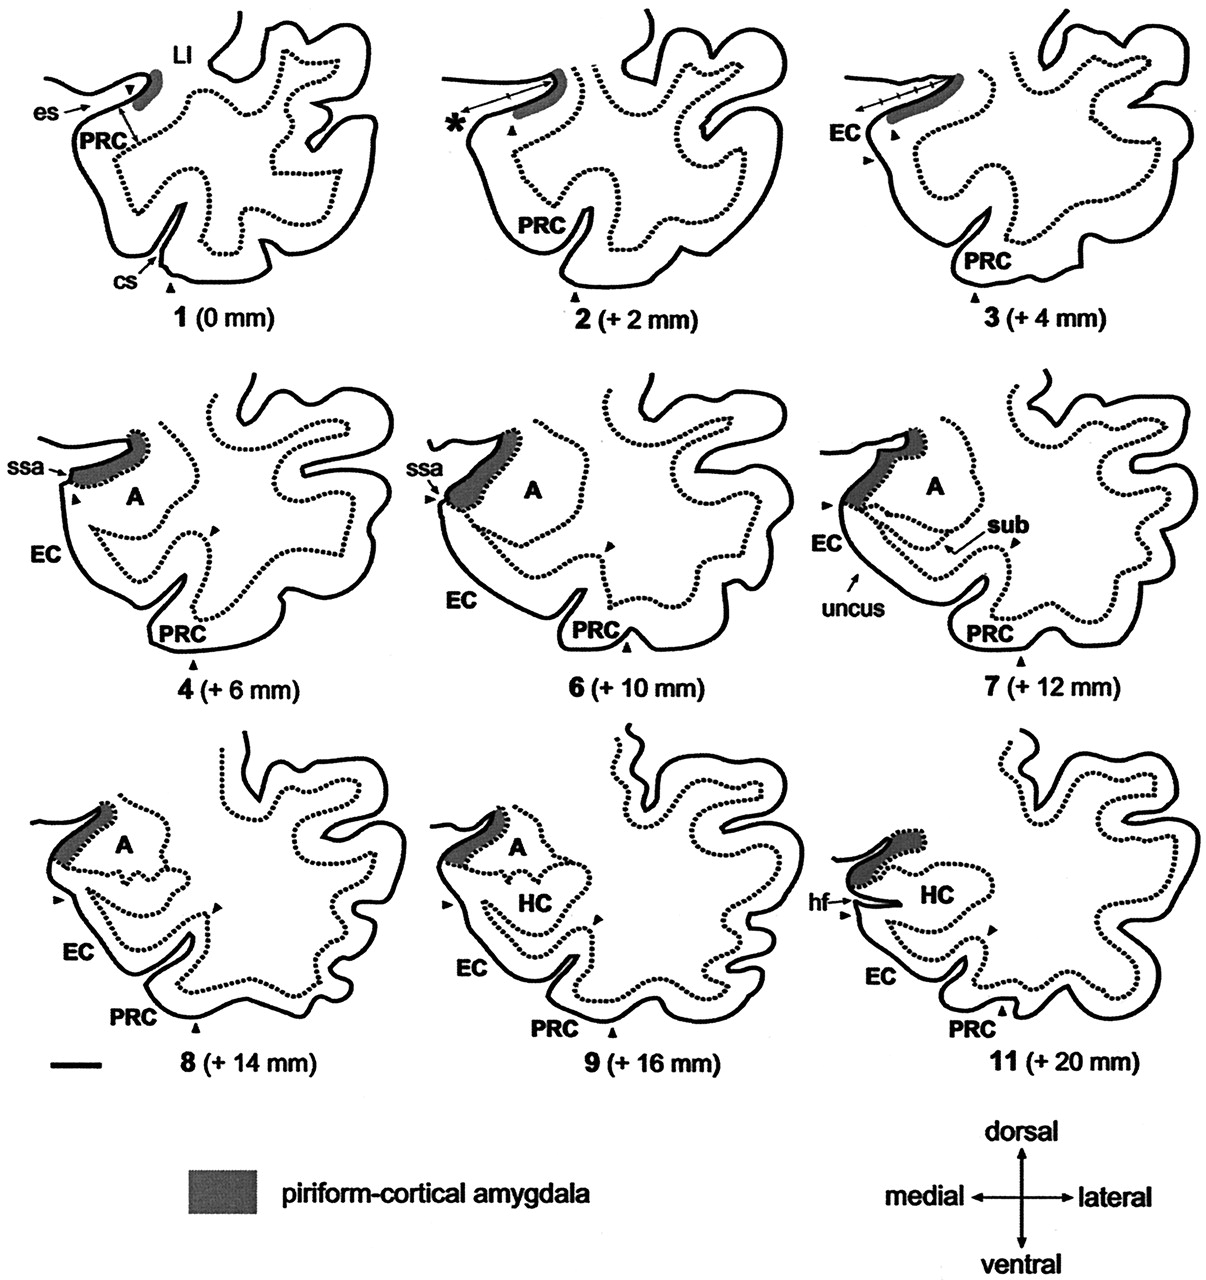
Line-drawings corresponding to MR images in Figure 4 summarize the anatomic landmarks used to draw the outlines of the PCA. Only the images displaying critical landmarks are shown. In section #1 (Fig 4A), the appearance of the limen insulae (LI) marks the reference level for outlining the PCA. At this level, the PCA extends 30% of the distance between the endorhinal sulcus (es) to the most convex point of the medial temporal cortex (asterisk). Its thickness is reaches 25% that of the adjacent perirhinal cortex (PRC). In section #2 (Fig 4B), the PCA occupies 50% of the distance of the endorhinal sulcus-medial temporal lobe convexity (arrow). Its thickness is 25% of that of the adjacent PRC. In section #2 (Fig 4C), the PCA extends down as far as the continuation of the limit of the white matter at its crossing with the pial surface (alternatively, if it were absent, the limit is given by the visualization of the sulcus semiannularis). This distance represents up to 80% of the distance of the es-medial temporal lobe convexity. The PCA borders ventrally the most medial aspect of the entorhinal cortex (EO subfield) (49). Its thickness is 25% that of the adjacent PRC. Section #4 (Fig 4D) is at the level of the rostralmost portion of the amygdala. At this level, the PCA extends from the endorhinal sulcus down to the sulcus semiannularis (ssa), or in its absence, as in the previous level. Its thickness encompasses the entire cortical gray matter. In section #6 (Fig 4F), the amygdala is larger. The PCA occupies the entire medial temporal cortex down from the endorhinal sulcus to the sulcus semiannularis. Its thickness encompasses the entire cortical gray matter. In sections 7–9 (Fig 4G–I), the rostral hippocampus appears. The PCA is defined as in level #6. In section #11, the opening of the hippocampal fissure (hf) marks the last image to be quantified. HC indicates hippocampus; cs, colateral sulcus; Sub, subiculum. Scale bar equals 10 mm (all panels).
Cortical Amygdala.
The cortical amygdala is the most caudal segment of the olfactory allocortex, located on the medial surface of the human temporal lobe (62). It is composed of several superficial amygdaloid nuclei with defined cytoarchitectonic, chemoarchitectonic, and connectional characteristics (for nomenclature, see [57]). The present volumetric analysis included the cortical nuclei of the amygdala (cortical amygdala, for short, composed of the anterior cortical nucleus, the medial nucleus, the nucleus of the lateral olfactory tract, olfactory amygdala [63]), the periamygdaloid cortex (PAC0, PAC1, PAC2, PAC3, and PACS subfields), and the posterior cortical nucleus (Fig 1). Rostrally, the cortical amygdala is located caudal and ventral to the PC (Fig 1B) and caudal to the perirhinal cortex (PRC) (Fig 1A). It extends down to the ventral bank of the sulcus semiannularis (ssa) where it borders the entorhinal cortex (Fig 1B–C). At caudal levels it becomes continuous with the amygdalo-hippocampal transitional area (Fig 1D).
Rostrally, the cortical amygdala (including the PACo) appears at the level of the beginning of the amygdala approximately 6 mm caudal to the LI (64) (Figs 1B and 5). At this level, the cortical amygdala occupies approximately 80% of the mediolateral extent of the cortex in the dorsal aspect of the medial temporal lobe (see above). One section caudally, where the amygdaloid complex is larger (Fig 5) and often the temporal horn of the lateral ventricle is present, the cortical amygdala (including the anterior cortical nucleus, nucleus of the lateral olfactory tract, PAC3, and PACs) extends as far as the border with the rostromedial portion of the entorhinal cortex at the fundus of the sulcus semiannularis (49). In cases, where the sulcus semiannularis is not apparent, the border defined by the line extending medially from the white matter to the surface of the brain was used as the ventral border of the cortical amygdala (Fig 5) (50). At the beginning of the subiculum at the head of the hippocampus (64), the cortical amygdala (medial nucleus, posterior cortical nucleus, PACs) becomes continuous with the amygdalo-hippocampal transitional area (AHA) (Fig 1D).
Amygdalo-hippocampal Transitional Area.
This transitional area between the hippocampus and the amygdala (65) continues caudally the gyrus semilunaris, approximately at the level of the diverticulum unci (66). The caudal end of the cortical amygdala comes into close contact with the amygdalo-hippocampal transitional area (AHA), which establishes the link between the rostral extremity of the uncal hippocampal allocortex and the caudal end of the olfactory amygdala. Due to the lack of any apparent landmarks to separate the AHA from the cortical amygdala, it was included in the volumetric measurement.
The amygdalo-hippocampal area becomes apparent at the caudal part of the gyrus uncinatus, rostral to the hippocampal fissure (Fig 1D). The caudal limit of the AHA was coincident with the beginning of the hippocampal fissure in most of the cases.
Definition of the PCA Borders on Coronal MR Images
The PCA was outlined from the rostral to caudal direction, according to the MR imaging step-by-step protocol defined below. Before PCA measurements in TLE patients, ten randomly assigned control subjects were selected for intra- and interobserver tests to assure the reproducibility of the protocol. Measurements of TLE subjects were performed by a single investigator (P.M.G.P.) who was blind to the patient’s clinical and electroencephalographic characteristics. In cases where the cortical boundaries were not clear, a second opinion (T.S.) was obtained.
The localization of the PCA region in the medial temporal lobe is presented in coronal MR images in Figures 3 and 4 and schematically in corresponding line-drawings in Figure 5.
Step 1
The coronal MR image containing the LI was selected (Figs 3A, 4A and 5). At this level, the PCA is composed of the PC, which was not identifiable in terms of different contrast. Therefore, based on histologic analysis, the PCA outline was drawn to include 30% (approximately one-third) of the distance from the endorhinal sulcus to the most convex point of the medial temporal lobe. Its thickness was determined to be one-fourth (25%) of the thickness of the adjacent perirhinal cortex (PRC), as indicated on Figure 4A.
Step 2
In the next section (Figs 4B and 5), the PCA occupies one-half (50%) of the distance from the endorhinal sulcus to the gyrus semilunaris (most medial bump of the medial temporal cortex). Caudal to this level, the PCA included three-fourths (75%) of that distance (Figs 4C and 5) up to the appearance of the amygdala. Its thickness was drawn as 25% of that of the PRC, as in step 1, and as indicated on Figure 4B.
Step 3
Next, the characteristic ovoid shape of the amygdala became visible on MR images (Figs 3B, 4D and 5). At this level, the entire cortex from the fundus of the endorhinal sulcus to the most medial point of the gyrus semilunaris on the medial temporal cortex was included into the PCA. If the sulcus semiannularis was already present, the fundus of the sulcus was considered to be the ventral limit of the PCA. The entire thickness of the cortex was included in the PCA.
Step 4
On the next 2.0-mm MR image (Figs 4E–F and 5), the cortex extending from the endorhinal sulcus to the fundus of the sulcus semiannularis was included in the PCA. The entire thickness of the cortex was included in the PCA.
Step 5
Starting approximately 12 mm from the LI, the amygdala is at its largest and the temporal horn of the lateral ventricle appears ventrolateral to the amygdala (Figs 3C, 4G and 5). At this level, the sulcus semiannularis is near its end, and it may be either absent or show a shallow appearance on MR images. If the sulcus semiannularis is visible, the PCA extends from the fundus of the endorhinal sulcus to the fundus of the sulcus semiannularis. In the cases were the sulcus semiannularis cannot be identified, the approximate ventral limit of PCA was determined by the intersection of the line extending from the white matter under the amygdala (medial extension of the external capsule) to the surface of the brain, as defined previously (50) for the entorhinal cortex. The entire thickness of the cortex was included into the PCA. In more caudal sections where the rostral end of the hippocampus (uncus) appears (Figs 3D, 4H–I, and 5), the PCA is defined accordingly.
Step 6
At the caudal end of the amygdala (Figs 3E, 4J–K and 5), the gyrus ambiens, including the medial intermediate subfield of the entorhinal cortex, is replaced by the amygdalo-hippocampal area and the uncus, which is composed of the subiculum and the CA1 subfield (64, 65). At this level, the endorhinal sulcus becomes very narrow and locates in close proximity to the optic tract. The last section, in which the PCA was present, was usually coincident with the opening of the hippocampal fissure (Figs 3F, 4K and 5). The outlines of the PCA were drawn as in Step 5.
Once the PCA cortices were outlined on each of the coronal images, the final volume was calculated by using a program developed in-house for a standard work console.
Statistical Analysis
The mean, SD and coefficient of variation of the PCA volume, and the MR imaging data were computed by using SPSS/PC+ Statistical Software Package 11.0 (SPSS, Inc., Chicago, IL), and the normal distribution was analyzed by the Kolmogorov-Smirnov test.
As it is generally accepted that interindividual variability in head size affects the volumes of brain regions, we corrected the PCA volume to the individual brain area obtained at the level of the anterior commissure, according to Cendes et al (67) with modifications (68). Briefly, we used the formula: (overall mean control intracranial area/intracranial area for each subject) x measured cortical raw PCA volume of the subject.
Ten randomly assigned control subjects were selected for intra- and interobserver tests, by using the method introduced by Bland and Altman (69). Repeated measurements were performed for 10 control subjects. The limits of agreement between the first and second measurement were defined as the mean difference in volume (first minus second measurement) ± 2 SD of the mean difference (Fig 6). The clinical significance of the intra- and interobserver variability was assessed by comparing the limits of agreement with (a) the total volume of the PCA, (b) the mean volume reductions, and (c) the volume considered to be a marker of volume reduction in individual analyses (> 2 SD from the mean of control subjects). The mean difference in volume was near zero and thus, not considered significant.

Scatter plots show the intra- and inter-observer variability of repeated measurements in the assessment of the right and left volume of the PCA of 10 control subjects. A, shows intra-observer measurement (P.M.G.P.); and B, inter-observer measurement (P.M.G.P. versus T.S.). The limits of agreement between the first and second measurements are expressed as the mean difference in volume: [volume in the first measurement minus volume in the second measurement (mm3)] ± 2 SD. Inserts in the lower left corner show the association between the first (x-axis) and second (y-axis). Mean indicates mean difference in volume; +2 SD, mean difference in volume plus two SD; −2 SD, mean difference in volume minus two SD.
For statistical analysis, the patients were divided into two groups according to localization of the seizure focus: TLE patients with focus on the right and TLE patients with focus on the left. Because the initial statistical survey indicated that the parameters studied were not normally distributed and the number of subjects in each study group was small, nonparametric analyses were used. First, the mean PCA volumes between control subjects and patients with left or right TLE were compared by using the Kruskal-Wallis test. Differences between the study groups were determined by using the Mann-Whitney test with the Bonferroni adjustment (x 3) for multiple comparisons. To assess the degree of volume asymmetry, the PCA asymmetry ratio was calculated according to Bernasconi et al (70): [Asymmetry (%) = (100 x (R-L)/((R+L)/2) where R refers to the volume on the right and L to that on the left. In control subjects, right–left asymmetry in the volumes was analyzed by using Wilcoxon’s test with two related samples, and the effect of sex was analyzed by using a Mann-Whitney test. Subsequently, patients were divided accordingly to their measured hippocampal volumes (HCvol) in HS patients, if the volume was less than two SD from the control mean and without HS if HCvol was at least two SD from the control mean. A P value of less than .05 was considered statistically significant.
Results
Stereological Determination of PCA Volume in Control Subjects
The mean ± 1 SD volume of PCA was 280 ± 27 mm3 (ranged between 254 to 331 mm3). Figure 7 is the plot of the volume estimation for the PCA areas in the seven hemispheres quantified. The variability was not due to the method of volume estimation since the coefficient of error was, in average, less than 2%. In addition, the contribution of the point counting to the overall coefficient of error was approximately half of the contribution of the variability between sections. Values obtained were smaller compared with MR imaging determinations. This difference can be accounted for by the retraction of tissue (up to 48%, [Mouritzen Dam, 1979 #1795]) due to fixation in 4% paraformaldehyde and staining process.

Plot of the individual volume estimation of the PCA, obtained by the stereological assessment of seven brain hemispheres (see Materials and Methods section for details). Each square represents a case. Group mean ± 1 SD is indicated on the right side.
Control Subjects
The mean normalized volumes and the asymmetry ratios of the PCA volumes in control subjects are shown in Table 2. There was no significant right–left asymmetry in the mean volumes. There was no sex difference in the PCA volumes. Also, there was no correlation between PCA volume and age.
Normalized volumes and asymmetry ratio of the right and left piriform-cortical amygdala in control subjects and patients groups and subgroups
Patients with TLE
The sex distribution and mean age did not differ between control subjects and patients with TLE. When control subjects and patients with right or left TLE were compared, there were differences in the mean PCA volumes between groups.
Patients with right TLE
The mean ipsilateral PCA volume was 18% smaller than in control subjects (P < .001). The mean contralateral PCA volume did not differ from that in control subjects (Table 2). Also, the mean asymmetry ratio was higher than that in control subjects (P < .001). There was a greater than 10% decrease in the right PCA volume in three patients and a greater than 20% volume decrease in 10 patients. Additionally, the mean right PCA volume was 15% smaller than that in left TLE patients (P < .01).
Patients with left TLE
The mean left PCA was 16% smaller than in control subjects (P < .01) and 19% smaller than in the right TLE group (P < .001). The mean right PCA did not differ from that in control subjects. The mean asymmetry ratio was higher than in control subjects (P < .05), indicating that PCA volumes were smaller ipsilateral to the focus. In this group, there was a greater than 10% decrease in the left PCA volume in five patients and a greater than 20% decrease in eight.
PCA atrophy was bilateral in 18% (7/39) of the patients (five patients with bilateral PCA volumes reduction were over 20% and two patients presented bilateral reductions over 10%).
PCA Volume in Patients With Hippocampal Atrophy
We assessed whether the volume reduction within the PCA is associated with hippocampal, amygdaloid, or entorhinal atrophy (Table 1). In control subjects, both right and left PCA volumes correlated with the volume of the right (r = 0.447, P < .05) or the left (r = 0.524, P < .01) hippocampus, respectively. There was no correlation with amygdala volumes, but the volume of the right PCA correlated with that of the right entorhinal cortex (r = 0.467, P < .05).
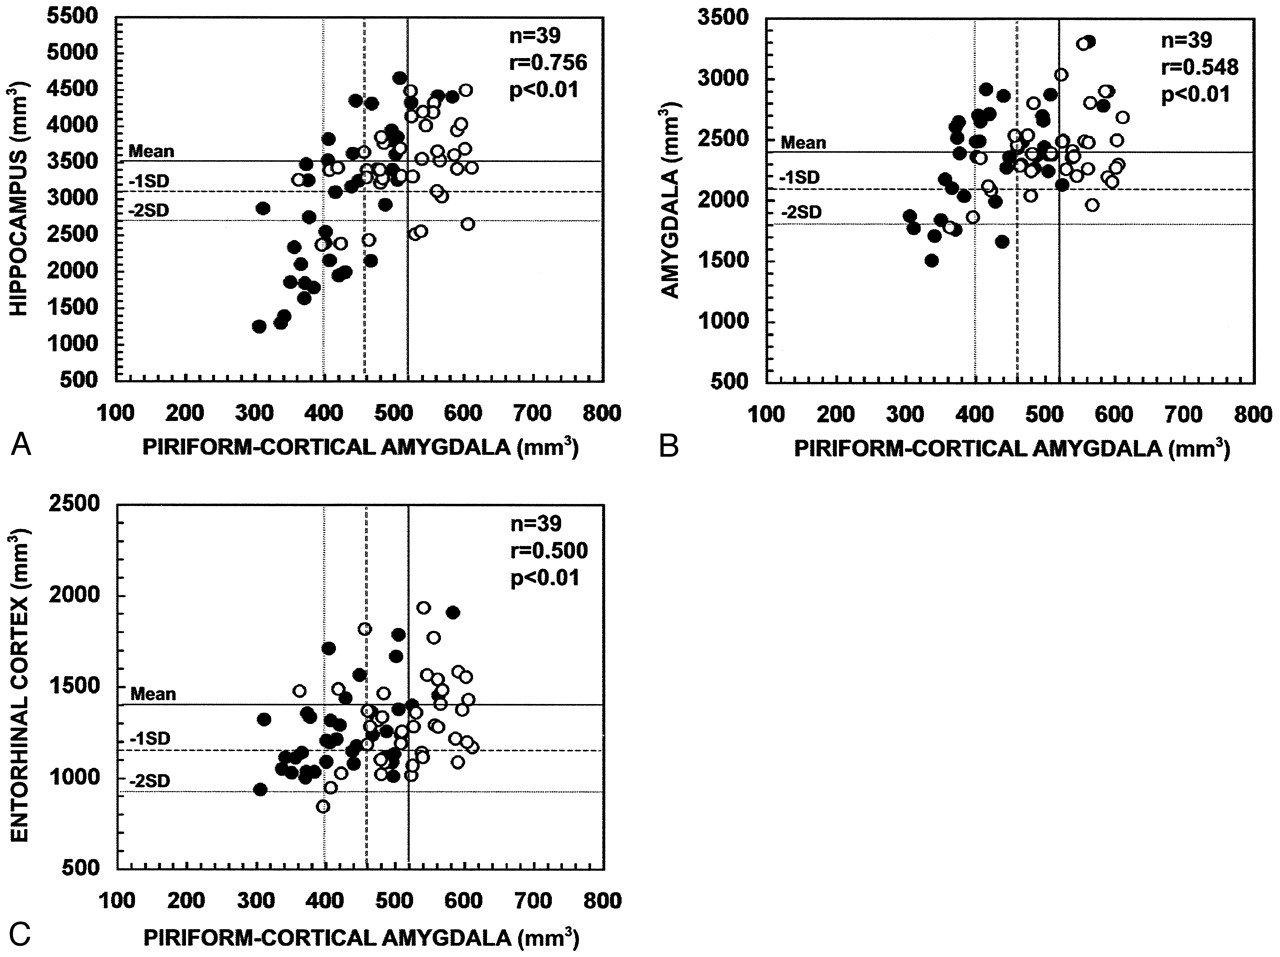
In all patients with TLE (Fig 8), the volume of the PCA ipsilateral to the seizure focus correlated with the ipsilateral hippocampal volume (r = 0.756, P < .01), ipsilateral amygdala volume (r = 0.548, P < .01), and ipsilateral entorhinal cortical volume (r = 0.500, P < .01). The contralateral PCA volume correlated with the contralateral hippocampal volume (r = 0.363, P < .05), contralateral amygdala volume (r = 0.397, P < .05), but not with the contralateral entorhinal volume (r = 0.158, P > .05).

Scatter plots show the correlation between the ipsilateral and contralateral volumes of the PCA and the volumes of the hippocampus (A), amygdala (B), and entorhinal cortex (C) in patients with TLE. PCA volumes correlated with the atrophy in the hippocampus, amygdala, and entorhinal cortex. Closed circles refer to the ipsilateral values and open circles to the contralateral values. Mean indicates mean volume in control subjects; - 1 SD, mean volume in control subjects minus one SD; - 2 SD, mean volume in control subjects minus two SD; n, number of patients; r, Pearson’s correlation coefficient.
To assess whether TLE patients with a hippocampal volume reduction of at least two SD on the side of the seizure focus have more substantial PCA atrophy than patients with milder hippocampal atrophy, the PCA volume in the TLE subgroups was evaluated (Table 2). Eight patients with right TLE and 11 patients with left TLE had a volume reduction of at least two SDs from the mean of control subjects (at least 19% volume reduction) in the ipsilateral hippocampus, and the mean hippocampal volume was reduced by 45% on average compared with the control group. In patients with right hippocampal atrophy, the mean right PCA volume was reduced by 28% (P < .001) compared with control subjects. In patients with left hippocampal atrophy, the mean left PCA volume was 24% smaller than in control subjects (P < .001). Additionally, the mean PCA volumes were 18% smaller in patients with hippocampal atrophy compared with patients without hippocampal volume reduction (P < .01, on both subgroups). Three patients without HS had a reduction of at least two SD in the ipsilateral PCA volume and six patients with HS had normal PCA volumes.
PCA Volume in Patients with Amygdaloid Atrophy
Two patients with right TLE and one with left TLE had a volume reduction of the ipsilateral amygdala of at least two SDs of the control mean. Both right TLE patients with amygdala atrophy had a PCA volume of at least two SDs below the control mean.
There were no patients with an entorhinal cortex volume reduction of less than two SDs from the mean of the control subjects (54).
Association of the PCA Volumes with Lifetime Seizure Number
The volume of the ipsilateral or contralateral PCA did not correlate with the lifetime seizure number.
Discussion
In the present study, we developed a method to measure the volume of the PCA in coronal MR images of the human brain. This method allowed us to assess the occurrence and severity of PCA atrophy in patients with TLE and its co-occurrence with volume reduction in the hippocampus, amygdala, or entorhinal cortex. Only patients with an unknown etiology for TLE were included in the study. After establishing the adequate methodological considerations, the study revealed four major findings. First, there was no hemispheric asymmetry of the PCA in control subjects. Also, the volume did not vary depending on the sex or age of the subjects. Second, in approximately 40% of patients with TLE there was at least a 20% volume reduction in the ipsilateral PCA. Third, PCA atrophy strongly correlates with HS and the side of the seizure focus. Fourth, there was no association between the PCA volumes and lifetime seizure number.
1. Methodological Considerations
The purpose of this study was to investigate the occurrence of damage in the PC and the cortical amygdala in patients with TLE by means of quantitative MR imaging. Based on histologic analysis, we have elaborated a protocol that can be used to measure the volume of the human PCA in 2.0-mm-thick coronal MR images, which provides additional information on the structural integrity of the medial temporal lobe. Our MR protocol was designed based on anatomic landmarks derived from the analysis of histologic sections from postmortem brains of healthy subjects. Thus, we were able to locate the different segments of the PCA and extrapolate the findings to determine the boundaries on MR images. The major difficulty was in determining the thickness of the piriform cortex. This cortical area appears embedded in the endorhinal sulcus on the first three MR images, starting at the LI, and there are no clear reference points to delineate this region on MR images. Therefore, we used the thickness of the neighboring perirhinal cortex as a reference. Consequently, it is possible that atrophy of the perirhinal cortex can bias the estimation of the volume of the PCA. It is, however, important to realize that this would compromise the thickness measurement in only three of 11 coronal sections, and the volume of this portion of the PCA is no more than 18% of the total PCA volume. Also, volume reduction of the perirhinal cortex is relatively uncommon, even in patients with intractable epilepsy (8, 10, 71). Therefore, we concluded that the use of the perirhinal cortex to define the thickness of the piriform component of the PCA does not significantly affect the data evaluation. Contrary to the PC, the cortical amygdala and the amygdalo-hippocampal transition area (the remaining 82% of total PCA volume) are readily identified on T1-weighted MR images by their different contrast, allowing their separation from the adjacent amygdala and hippocampus.
The thickness and orientation of the MR images was set according to identical thickness and orientation of the histologic sections, facilitating in this way the identification of the boundaries and minimizing partial volume effects. Even so, partial voluming is an inherent property of the discretized image and would still persist if the contrast between tissues were maximal or if the thickness was sub-milimetric. Moreover, at 1.5T, the volumetrics of parahippocampal cortices should rely as much as possible in the correct recognition of the same anatomic boundaries as seen on histologic examination (50, 54, 72–74), which are crucial for accurate delineation of the region of interest (75, 76). Therefore, it is advisable to employ identical section thickness to use the minimum number of MR partitions to estimate the volumes (77).
Except for the hippocampus and amygdala, focal atrophies of the para-hippocampal cortices are virtually indiscernible with current cross-sectional high-resolution imaging. Similarly, PCA atrophies can only be detected quantitatively. It is possible, however, that MR imaging performed at higher fields than 1.5T with tailored sequences for the mesio-temporal cortices, could demonstrate such abnormalities qualitatively.
One novel result of this study was to identify PCA damage in drug-refractory TLE patients. Still, we were unable to confirm our data histologically. Indeed, to date there exists no gold standard consisting of MR imaging and histologic analysis of the same TLE cases. Future post-surgical or autopsy-based studies are needed to substantiate our data and to definitively establish the role that the human PC and cortical amygdala have as critical areas in epileptogenesis.
2. PCA Volume as a Marker for Seizure Lateralization
The results indicate a high concordance between PCA atrophies on one hand, and the EEG findings and the hippocampal atrophies, on the other.
In the present study, 44% patients had a PCA volume reduction of at least 2 SD below the control values. Of these patients, 76% had an asymmetry index higher than 2 SD of control subjects. The remaining 56% of patients had a normal PCA volume (within mean ± 2 SD limits), but also had an asymmetry index with a trend toward abnormality on the side of the focus (32% of these patients had a volume asymmetry higher than 2 SD of control subjects). These data suggest that a reduced PCA volume or abnormal asymmetry index can be a useful addition to the tools currently used to determine the side of the seizure focus.
3. PCA Atrophy is One Component of Overall Damage in the Temporal Lobe
Volumetric MR imaging measurements of the amygdala (7, 67), entorhinal (54, 70), perirhinal (10) and parahippocampal (71) cortices, thalamus, lenticular and caudate nuclei (78), fornix, and mammillary bodies (79, 80) support the concept that tissue damage in TLE is not limited to the hippocampus, but involves other associated limbic structures. Our data demonstrate that even though a most of patients with HS also have ipsilateral PCA atrophy, the PCA volume is normal in 31% of HS patients. Further, 15% of patients with normal hippocampal volumes had a volume reduction in the PCA. These data are consistent with previous data suggesting that structural atrophy secondary to cell loss often extends outside the hippocampus. Furthermore, in the absence of clearly identifiable HS in TLE, extra-hippocampal damage, including that in the PCA, can be part of the epileptogenic zone responsible for the symptomatic findings. Whether the damage in these various brain areas occurs at the same time or develops in parallel or sequentially later during the epileptogenic process (6) remains to be studied, along with the relative sensitivity, specificity and predictive value of the various quantitative MR imaging protocols that we have at our disposal to characterize the overall brain damage induced by TLE.
Conclusion
The volumetric measurement of the PCA is feasible in human MR images despite its small size. Atrophy of the PCA occurs in a subgroup of patients with TLE and the severity of the volume reduction correlates with hippocampal atrophy. These data demonstrate that the PCA is one component of the damaged temporal lobe network in humans. Furthermore, volumetric assessment of the PCA provides additional information to determine the lateralization of seizure focus.
Acknowledgments
We thank Professor Fernando Lopes da Silva for his constructive comments on the final version of this article. We thank Mrs. Teresa Carracho (the Grünenthal Foundation /Department of Design) for assistance in drawing Figure 5.
Footnotes
Sponsored by Grant BD 18498/98 for P.M.G.P. (The Science and Technology Foundation), the Grünenthal Foundation and the Gulbenkian Foundation, Portugal, Grant FIS 00/468 (Ministry of Health), and Grants PAI 02–022 and GC 02–022 (Department of Science and Technology, Government of Castilla-La Mancha), Spain, and the Academy of Finland, The Sigrid Juselius Foundation, the Kuopio University Hospital Research Fund, the University of Kuopio, and the Vaajasalo Foundation, Finland.
References
- Received February 26, 2004.
- Accepted after revision July 6, 2004.
- Copyright © American Society of Neuroradiology


