
Article Figures & Data
Figures
- Fig 1.
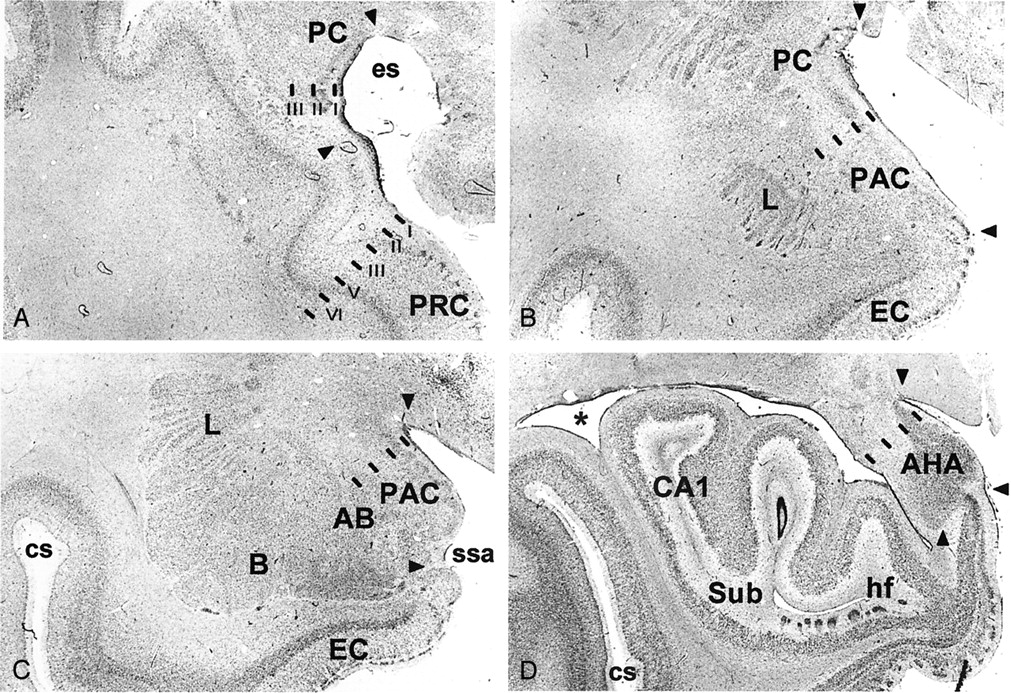
Brightfield photomicrographs of thionin-stained sections on the coronal plane show cytoarchitectonic borders (arrowheads) of the different components of the piriform cortex-cortical amygdala (PCA) region as defined in the present study. A is the most rostal (at the level of the limen insulae) and D is the most caudal (hippocampal head). PC indicates piriform cortex; PRC, perirhinal cortex; es, endorhinal sulcus; PAC, periamygdaloid cortex; L, amygdala lateral nucleus; EC, entorhinal cortex; AB, amygdala accessory basal nucleus; B, amygdala basal nucleus; ssa, sulcus semiannularis; cs, colateral sulcus; AHA, amygdalo-hippocampal area; CA1, hippocampal field 1; Sub, subiculum; hf, hippocampal fissure; asterisk, lateral ventricle. Scale bar equals 2 mm.
- Fig 2.
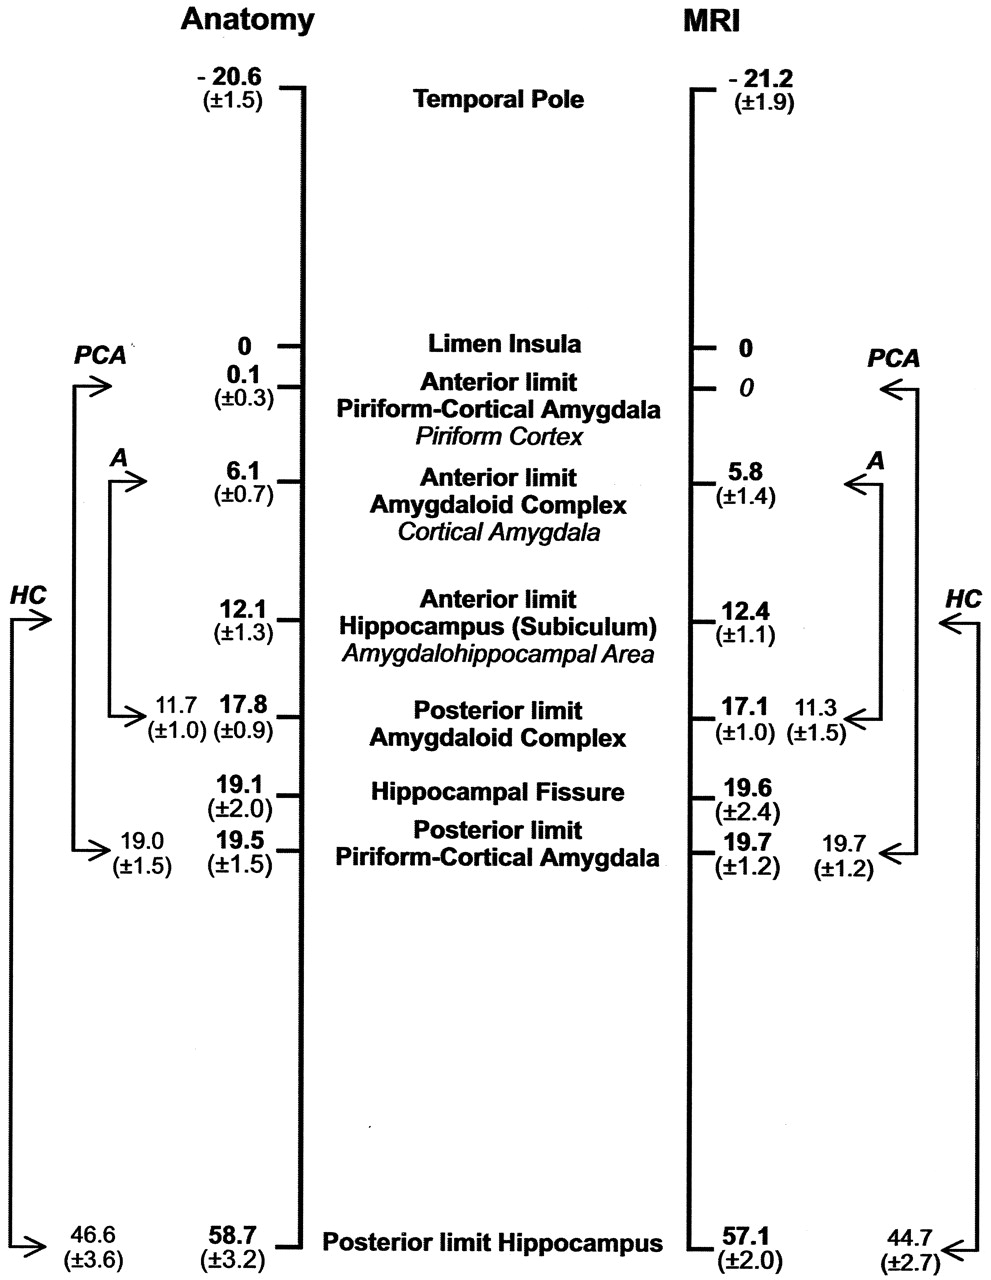
Schematic representation of the rostrocaudal location and extent of the major landmarks relative to the limen insula (set at 0) used to define the PCA. Numbers on the left (mean distance in millimeters ± SD) were calculated from control histologic cases (23 temporal lobes) and on the right from the MR imaging control group (46 temporal lobes). The values between arrows depict the mean (± 1 SD) distances between the rostro-caudal limits of the PCA, the amygdaloid complex (A), and the hippocampus (HC).
- Fig 3.
Successive 2-mm coronal MR images demonstrate the location of the PCA. A is the most rostral and F is the most caudal. A, Shows the limen insulae (LI); B, first section where the characteristic ovoid shape of the amygdala (A) can be recognized; C, full extent of the amygdala (A) with lateral ventricle appearing underneath (asterisk); D, appearance of the rostral hippocampus (HC); E, rostral hippocampus at the level of the hippocampal head and lateral ventricle (asterisk); and F, hippocampal fissure (hf; arrow). Scale bar equals 20 mm (applies to all panels).
- Fig 4.
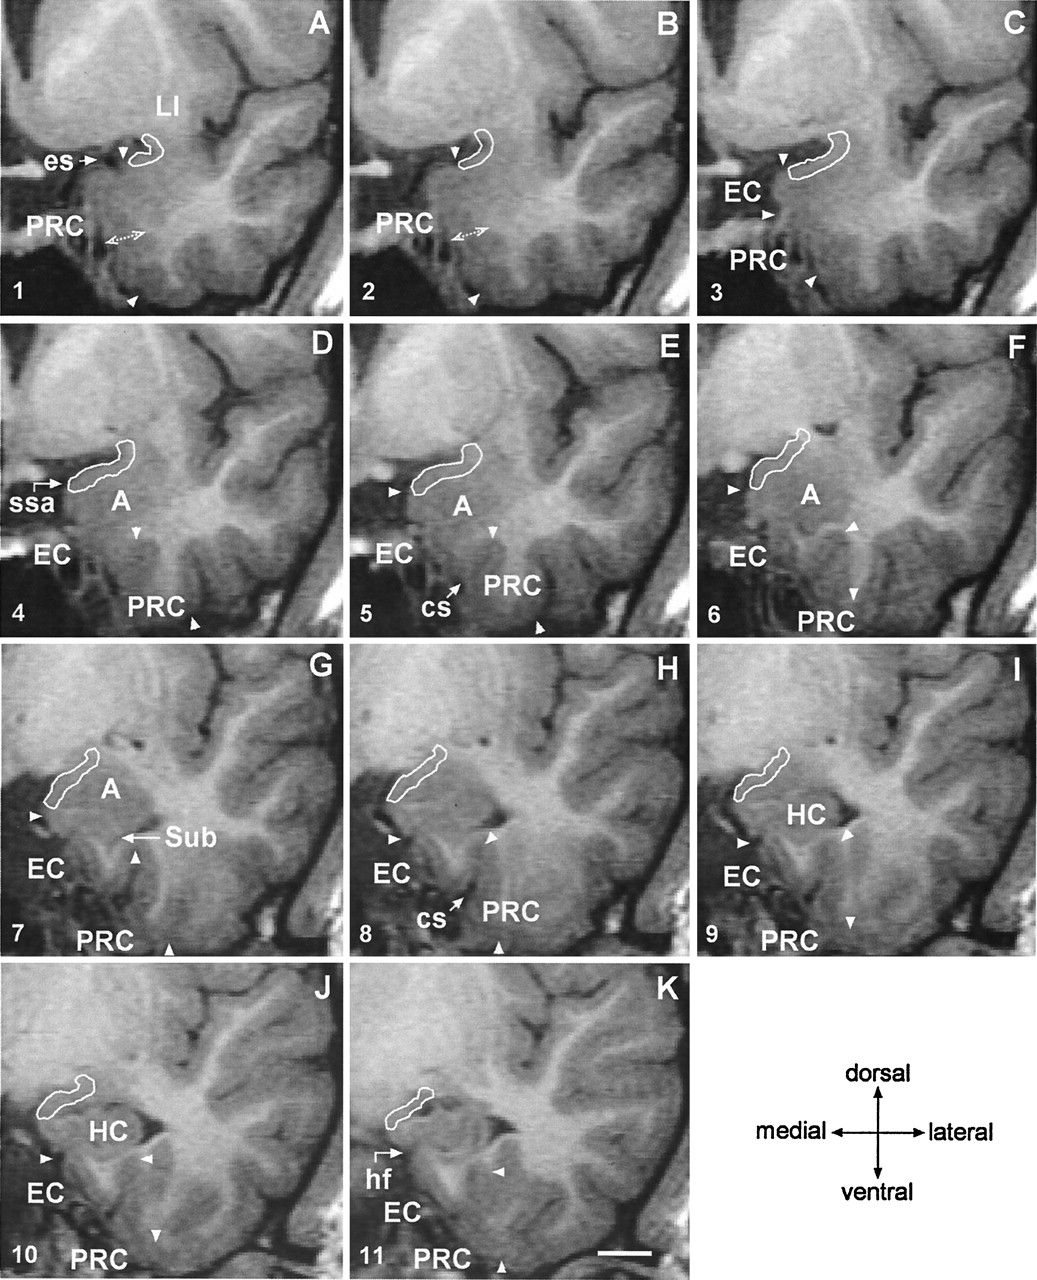
Coronal 2-mm-thick MR images from a control subject demonstrate the outline of the PCA at different rostrocaudal levels. Line drawings of the same MR imaging sections demonstrating more anatomic details are shown in Figure 5 (numbers in the lower left corner correspond to the levels of the line-drawings). A is the most rostral and K is the most caudal. In panels A and B, the thickness of the perirhinal cortex, which serves as reference for the thickness of the PCA is indicated. Panel C marks the anterior-most limit of the entorhinal cortex. In panels D, E and F, the characteristic ovoid shape of the amygdala can be recognized. Panel G shows the appearance of the subiculum. Panels H–K show the hippocampal head. EC indicates entorhinal cortex; cs, colateral sulcus (arrow); A, amygdala; es, endorhinal sulcus (arrow); HC, hippocampus; hf, hippocampal fissure (arrow); LI, limen insulae; PRC, perirhinal cortex; ssa, sulcus semiannularis (arrow); Sub, subiculum; and arrowheads, boundaries of the entorhinal and perirhinal cortices. Scale bar equals 10 mm (applies to all panels).
- Fig 5.
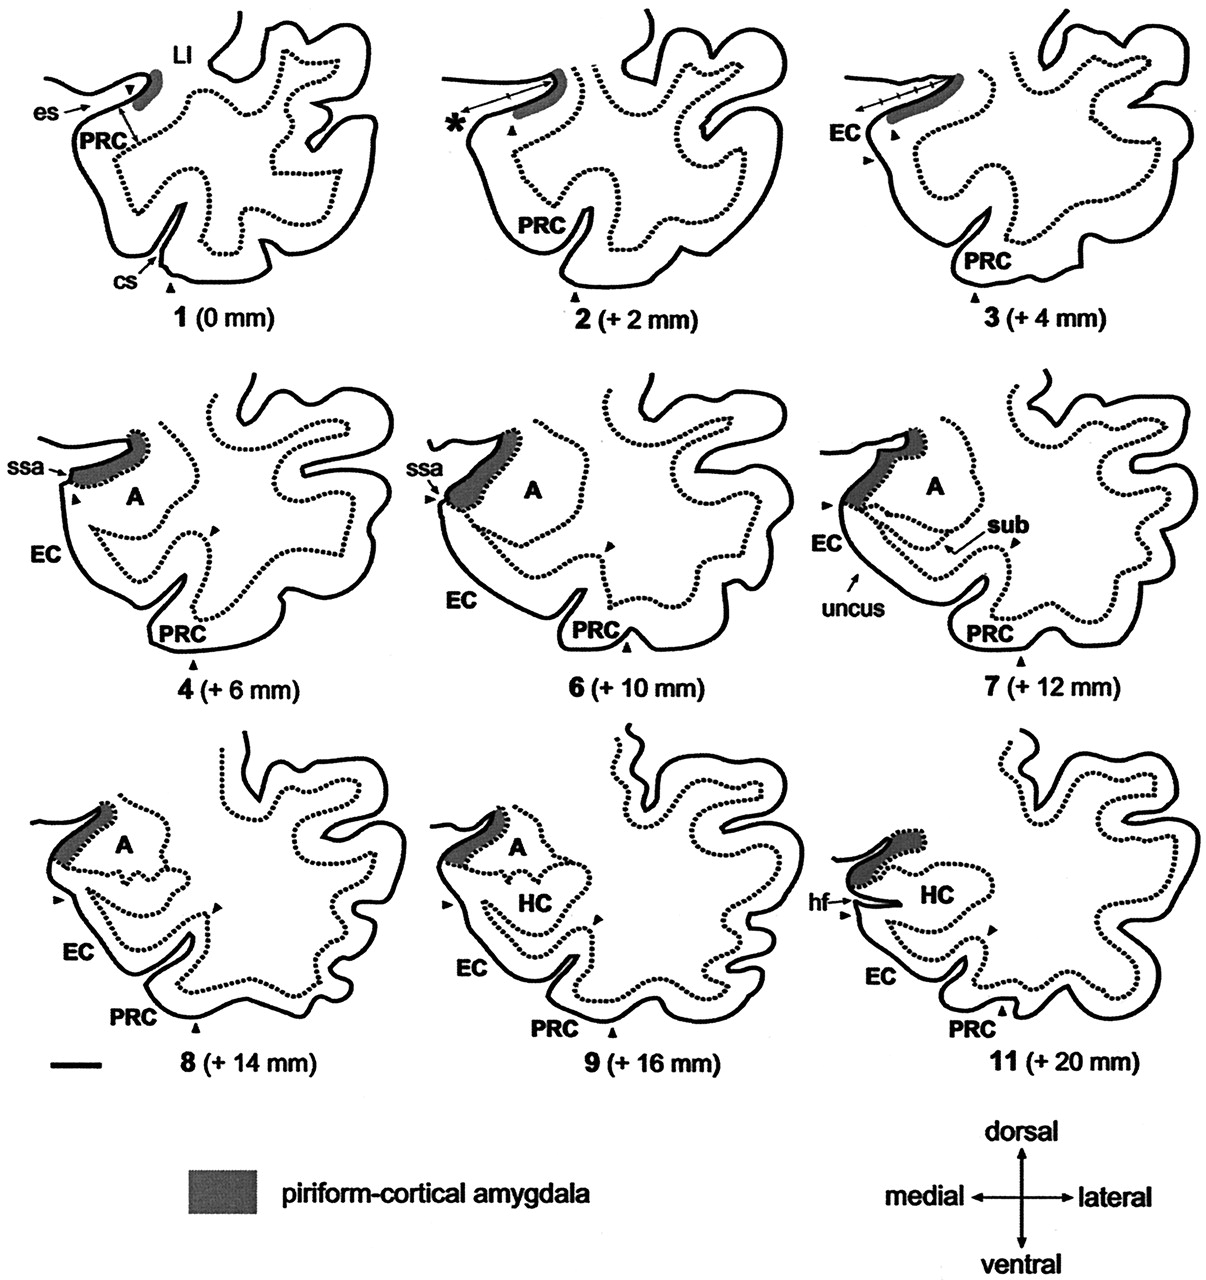
Line-drawings corresponding to MR images in Figure 4 summarize the anatomic landmarks used to draw the outlines of the PCA. Only the images displaying critical landmarks are shown. In section #1 (Fig 4A), the appearance of the limen insulae (LI) marks the reference level for outlining the PCA. At this level, the PCA extends 30% of the distance between the endorhinal sulcus (es) to the most convex point of the medial temporal cortex (asterisk). Its thickness is reaches 25% that of the adjacent perirhinal cortex (PRC). In section #2 (Fig 4B), the PCA occupies 50% of the distance of the endorhinal sulcus-medial temporal lobe convexity (arrow). Its thickness is 25% of that of the adjacent PRC. In section #2 (Fig 4C), the PCA extends down as far as the continuation of the limit of the white matter at its crossing with the pial surface (alternatively, if it were absent, the limit is given by the visualization of the sulcus semiannularis). This distance represents up to 80% of the distance of the es-medial temporal lobe convexity. The PCA borders ventrally the most medial aspect of the entorhinal cortex (EO subfield) (49). Its thickness is 25% that of the adjacent PRC. Section #4 (Fig 4D) is at the level of the rostralmost portion of the amygdala. At this level, the PCA extends from the endorhinal sulcus down to the sulcus semiannularis (ssa), or in its absence, as in the previous level. Its thickness encompasses the entire cortical gray matter. In section #6 (Fig 4F), the amygdala is larger. The PCA occupies the entire medial temporal cortex down from the endorhinal sulcus to the sulcus semiannularis. Its thickness encompasses the entire cortical gray matter. In sections 7–9 (Fig 4G–I), the rostral hippocampus appears. The PCA is defined as in level #6. In section #11, the opening of the hippocampal fissure (hf) marks the last image to be quantified. HC indicates hippocampus; cs, colateral sulcus; Sub, subiculum. Scale bar equals 10 mm (all panels).
- Fig 6.
Scatter plots show the intra- and inter-observer variability of repeated measurements in the assessment of the right and left volume of the PCA of 10 control subjects. A, shows intra-observer measurement (P.M.G.P.); and B, inter-observer measurement (P.M.G.P. versus T.S.). The limits of agreement between the first and second measurements are expressed as the mean difference in volume: [volume in the first measurement minus volume in the second measurement (mm3)] ± 2 SD. Inserts in the lower left corner show the association between the first (x-axis) and second (y-axis). Mean indicates mean difference in volume; +2 SD, mean difference in volume plus two SD; −2 SD, mean difference in volume minus two SD.
- Fig 7.
Plot of the individual volume estimation of the PCA, obtained by the stereological assessment of seven brain hemispheres (see Materials and Methods section for details). Each square represents a case. Group mean ± 1 SD is indicated on the right side.
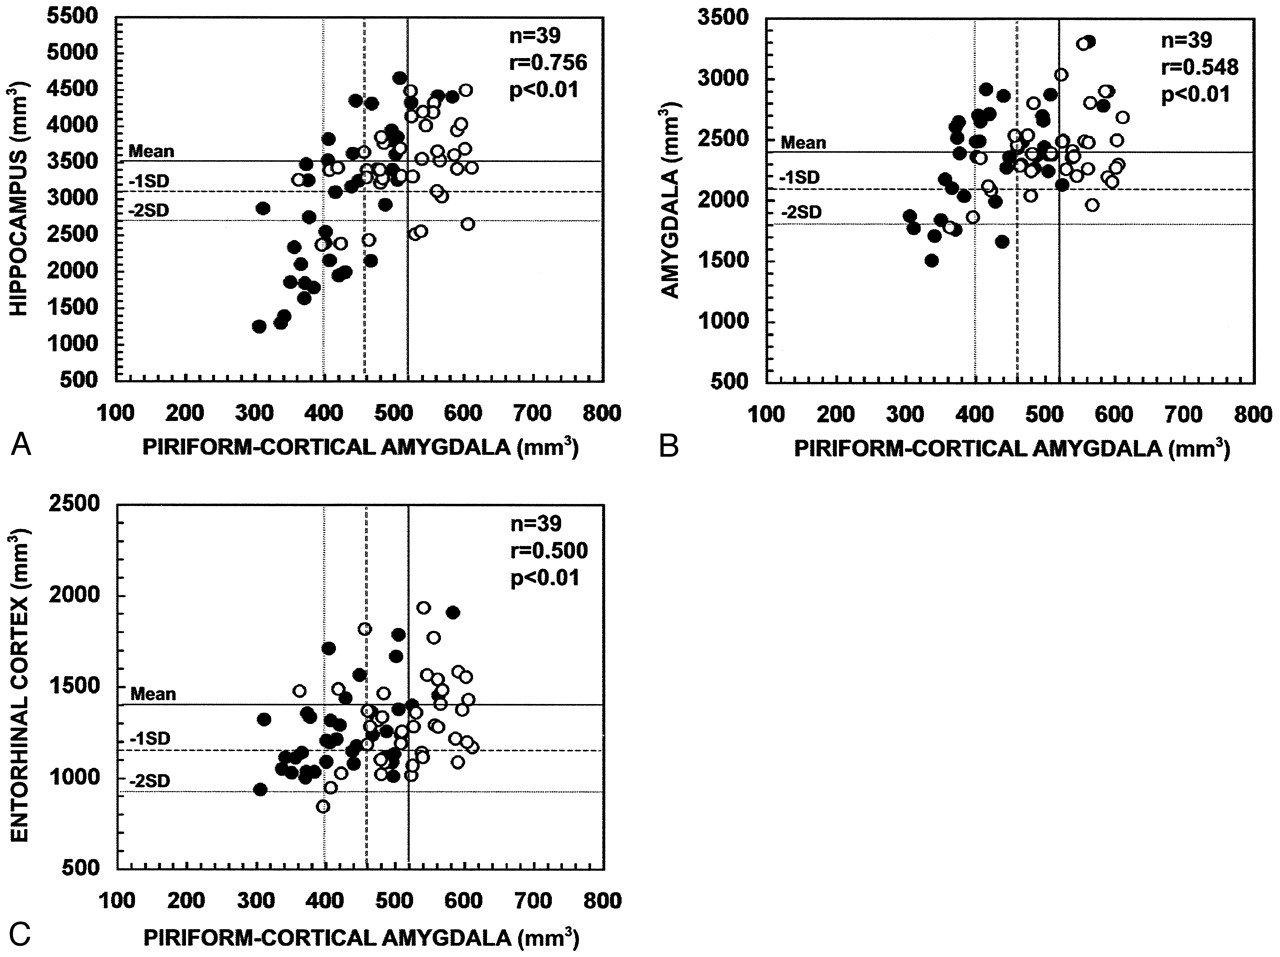
- Fig 8.
Scatter plots show the correlation between the ipsilateral and contralateral volumes of the PCA and the volumes of the hippocampus (A), amygdala (B), and entorhinal cortex (C) in patients with TLE. PCA volumes correlated with the atrophy in the hippocampus, amygdala, and entorhinal cortex. Closed circles refer to the ipsilateral values and open circles to the contralateral values. Mean indicates mean volume in control subjects; - 1 SD, mean volume in control subjects minus one SD; - 2 SD, mean volume in control subjects minus two SD; n, number of patients; r, Pearson’s correlation coefficient.


Tables
- TABLE 1:
Normalized volumes and asymmetry ratios of the right and left hippocampus, amygdala complex and entorhinal cortex
Group Hippocampus Δ HC Amygdala Δ AMY Entorhinal Cortex Δ EC Controls (n = 23) Right 3623 ± 468 (2825–4579) 2333 ± 263 (1983–2882) 1400 ± 279 (965–2088) Left 3412 ± 347 (2898–4186) 8.1 ± 6.2 2484 ± 400 (2041–3372) 9.0 ± 7.4 1399 ± 210 (1038–1809) 9.3 ± 7.3 Right TLE (n = 18) Right 3131 ± 1082 (1288–4404) 2336 ± 404 (1501–3303) 1272 ± 240 (999–1904) Left 3434 ± 539 (2507–4474) 25.4 ± 21.4 2459 ± 244 (2149–3027) 11.2 ± 11.0 1230 ± 176 (942–1580) 13.3 ± 9.8 Left TLE (n = 21) Right 3488 ± 591 (2360–4189) 2351 ± 352 (1774–3286) 1370 ± 272 (839–1929) Left 2851 ± 912 (1237–3840) 26.2 ± 24.5 2355 ± 395 (1657–2909) 10.1 ± 10.7 1248 ± 220 (934–1782) 12.8 ± 10.3 All volumes are presented as mean ± one standard deviation of the mean (range) and given in mm3. Asymmetry ratios (Δ) are presented as mean ± one standard deviation of the mean and given in percentages. HC indicates hippocampus; AMY, amygdala; EC, entorhinal cortex; TLE, temporal lobe epilepsy.
- TABLE 2:
Normalized volumes and asymmetry ratio of the right and left piriform-cortical amygdala in control subjects and patients groups and subgroups
Group Right PCA Left PCA Δ PCA Controls (n = 23) 530 ± 59 (422–644) 512 ± 60 (406–610) 7.2 ± 4.1 Right TLE All Patients (n = 18) 436 ± 71 (367–585)*** 526 ± 59 (408–612) 19.3 ± 12.6*** HS Patients (n = 8) 384 ± 28 (367–430)***°° 508 ± 59 (408–607) 27.1 ± 14.4*** Without HS (n = 10) 476 ± 69 (377–585) 541 ± 58 (461–612) 13.0 ± 6.3* Left TLE All Patients (n = 21) 512 ± 70 (364–605) 427 ± 68 (307–506)**€€€ 19.2 ± 16.0* HS Patients (n = 11) 492 ± 83 (364–603) 388 ± 61 (307–488)***¥¥ 24.0 ± 18.0* Without HS (n = 10) 535 ± 45 (458–605) 470 ± 47 (375–509) 13.9 ± 12.4 All volumes are presented as mean ± one standard deviation of the mean (range) and given in mm3. Asymmetry ratios (Δ) are presented as mean ± one standard deviation of the mean (range) and given in percentages. Nonparametric analyses with the Bonferroni correction were used to compare means over the study groups and to determine differences between the groups.
* P < .05,
** P < .01,
*** P < .001 compared to controls.
 P < .01 compared to left TLE patients,
€€€ P < .001 compared to right TLE patients,
°° P < .01 compared to right TLE patients without HS,
¥¥ P < .01 compared to left TLE patients without HS. HS indicates hippocampal sclerosis; PCA, piriform-cortical amygdala; TLE, temporal lobe epilepsy.


