
Abstract
BACKGROUND AND PURPOSE: The purpose of this study was to determine whether qualitative and quantitative measures obtained with pulsed arterial spin-labeling (PASL) and apparent diffusion coefficients (ADC) improve glioma grading compared with conventional MR images.
MATERIALS AND METHODS: We prospectively performed 2 qualitative consensus reviews in 33 suspected gliomas: 1) conventional MR images alone and 2) conventional MR images with PASL and ADC. To calculate the diagnostic performance parameters of PASL and ADC, we used a qualitative scoring system on the basis of the tumor perfusion signal intensity (sTP) and visual ADC scoring (sADC). We then analyzed quantitative regions of interest and calculated the ratio of the maximum tumor perfusion signal intensity (rTPmax) and the minimum ADC value (mADC).
RESULTS: Two observers diagnosed accurate tumor grades in 23 of 33 (70%) lesions in the first review and in 29 of 33 (88%) lesions in the second review. The sensitivity, specificity, positive predictive value (PPV), and negative predictive value (NPV) for determining a glioma grading by using combined sTP and sADC scoring were 90.9, 90.9, 95.2, and 83.3%, respectively. Statistical analysis gave a threshold value of 1.24 for rTPmax and 0.98 × 10⁻³ mm/s2 for mADC to provide a sensitivity, specificity, PPV, and NPV of 95.5, 81.8, 91.3, and 90.1% and 90.9, 81.8, 90.9, and 81.8%, respectively. The receiver operator characteristic curve analyses showed no significant difference between the quantitative and combined qualitative parameters.
CONCLUSION: PASL and ADC significantly improve the diagnostic accuracy of glioma grading compared with conventional imaging.
The current reference standard for determination of grading of brain tumors is histopathologic assessment, but the limitations of this method are well known.1 Tumoral angiogenesis is a pathophysiologic process that has been linked to tumoral viability and grade.2,3 Consequently, a noninvasive measure of these parameters offers the potential to optimize treatment, categorize lesions, and influence their management. Advances in imaging are transforming our understanding of angiogenesis and the evaluation of drugs that stimulate or inhibit angiogenesis in preclinical models and human disease.4
Dynamic susceptibility contrast (DSC) perfusion MR imaging has provided information about neovascularity and angiogenesis in the brain.5–7 In clinical trials DSC perfusion MR imaging detected significant changes in tumor vascular characteristics after treatment with antiangiogenic agent8,9 and significantly correlated with the histopathologic microvessel attenuation on animal models.10 The quantification of the tumor vasculature permeability that can be calculated from DSC MR image improved the diagnosis of cancer.11–14 Recently, new intravascular contrast agent and work on animal tumor models was applied to DSC MR imaging and was used for noninvasive tumor grading.14–15
The pulsed arterial spin-labeling (PASL) MR perfusion technique allows cerebral blood flow (CBF) to be measured noninvasively without the use of exogenous contrast agents and uses water protons in arterial blood as an endogenous contrast agent, making it a perfectly safe imaging technique.16–18 A second version of quantitative imaging of perfusion with a single subtraction with addition of thin-section periodic saturation after inversion and a time delay (Q2TIPS) technique of PASL was a suitable method for assessment of microvascular perfusion and allowed distinction between high-grade and low-grade gliomas.19
Diffusion-weighted images (DWI) allow the characterization and differentiation of morphologic features of the tumor by measuring differences in the apparent diffusion coefficient (ADC) caused by changes in water proton mobility.20,21 The usefulness of the ADC measurement in preoperative grading of glioma is controversial. Kitis et al22 reported that ADC calculation could improve the diagnostic efficacy of MR imaging in the grading and differentiation of brain tumors. However, Kono et al23 reported some overlap between the ADCs of grade 2 astrocytomas and glioblastomas. Moreover, Lam et al24 reported that it was not useful in the preoperative grading of gliomas.
The sensitivity, specificity, positive predictive value (PPV), and negative predictive value (NPV) of conventional MR imaging in the prediction of glioma grades and histologic type are not high. The purpose of this study was to determine if qualitative and quantitative measures from PASL and ADC improve the grading of gliomas compared with conventional MR images.
Materials and Methods
Patients
The Institutional Review Board approved our study, and we obtained informed consent from all patients or members of their families. This prospective study examined a series of consecutive patients with suspected brain tumors detected on conventional MR images acquired between May 2005 and February 2006. We enrolled 41 patients with 45 suspected brain tumors. A total of 34 patients underwent both PASL and DWI before surgery or stereotactic biopsy. There were 7 patients who underwent both imaging modalities postoperatively, but the postoperative images demonstrated a residual mass with enhancement of contrast material. Of the 45 suspected brain tumors, we excluded 6 definite extra-axial tumors, 2 suspected pediatric medulloblastomas, 2 metastatic tumors, 1 abscess, and 1 hemorrhagic infarct when calculating the sensitivity, specificity, PPV, and NPV, to prevent overestimation of the diagnostic performance parameters for determining high-grade and low-grade gliomas. Finally, we enrolled 33 patients with 33 suspected gliomas. The patients’ ages ranged from 29 to 67 years, with a mean of 41 years (19 men and 14 women).
An experienced neuropathologist performed the histopathologic evaluation. All tumors were proved on pathologic examination and classified in accordance with the revised World Health Organization (WHO) system of brain tumors.25 Tissue for histologic analysis was obtained at stereotactic biopsy or during surgical resection of the tumor.
MR Imaging Protocol
We performed MR imaging using a 1.5T system (Signa Excite; GE Medical Systems, Milwaukee, Wis). We included axial fast spin-echo T2-weighted imaging, axial spin-echo T1-weighted imaging, fluid-attenuated inversion recovery (FLAIR) imaging, DWI, PASL, and contrast-enhanced axial and coronal T1-weighted imaging. For acquiring all the MR images, we used an 8-channel head coil for radio-frequency (RF) transmission and signal intensity reception.
The axial fast spin-echo T2-weighted sequence was performed with the following parameters: TR/TE, 4000/120 ms; echo-train length, 10; FOV 20 × 20 cm; matrix size, 256 × 256; and section thickness, 5 mm. The contrast-enhanced axial and coronal T1-weighted sequences were performed after administering 0.1 mmol gadodiamide per kg body weight. We performed the axial DWI using a single-shot spin-echo echo-planar sequence with the following parameters: b-value, 1000 s/mm2; FOV, 20 × 20 cm; matrix size, 128 × 128; and section thickness, 7 mm.
We performed the PASL perfusion MR imaging using a multisection flow-sensitive alternative inversion recovery (FAIR) technique. The FAIR sequence used alternating section-selective and nonselective RF inversion pulses and was performed during a TI of 1200 ms between labeling and image acquisition. We chose the TI range of 800 to 1600 ms on the basis of the T1 decay of the magnetically labeled water proton. We obtained the final FAIR perfusion maps by subtracting the nonselective inversion recovery images from the section-selective images. When we performed the multisection FAIR technique, we used these imaging parameters: TR/TE, 2000/15 ms; FOV, 24 cm; matrix size, 128 × 128; NEX, 100; section thickness, 5 mm; section number, 7; and section gap, 2 mm.
Image Analysis
To compare the diagnostic accuracy of conventional imaging with or without adjunctive PASL and ADC, each observer reviewed the MR images of the 33 suspected gliomas twice. In 1 review, the observers were given the conventional MR images only (conventional images-only). In the other review, the observers were given the conventional MR images, PASL, and ADC. The conventional MR images consisted of T1-weighted, T2-weighted, and contrast-enhanced T1-weighted images. Each observer participated in 2 review sessions, which were spaced 1 month apart to avoid recall bias. On imaging, the 2 observers diagnosed the lesions in 1 of 3 categories on the basis of consensus reading: 1) grade 4 glioma, 2) grade 3 glioma, and 3) grade 2 glioma. Final pathologic diagnosis of the lesions was performed with the same categories. The radiologic diagnosis of the suspected gliomas was correlated with the pathologic diagnosis.
For qualitative analysis of glioma grading on the conventional MR image, the interpretation was based on the central necrosis, the degree of contrast enhancement indicating breakdown of the blood-brain barrier, and T2 signal intensity partly related to tumor cellularity. Additional minor findings were hemorrhage, the degree of peritumoral edema, and mass effect.26–28 For qualitative analysis of glioma grading on the PASL image, interpretation was based on the appearance of the normal white matter and basal ganglia perfusion signal intensities. We classified the lesions using a 4-point scoring system (qualitative scoring of tumor perfusion signal intensity [sTP]): a signal intensity greater than the basal ganglia and less than the leptomeningeal vessels indicated hyperperfusion (4 points); a signal intensity equal to the basal ganglia, isoperfusion (3 points); a signal intensity less than the basal ganglia and greater than the white matter, hypoperfusion (2 points); and a signal intensity equal to the white matter, severe hypoperfusion (1 point). For the qualitative scoring of ADC (sADC), the interpretation was based on the appearance of the normal white matter and cerebrospinal flow (CSF) ADC. The 4-point scoring system was as follows: sADC less than the white matter indicated a low ADC (4 points); sADC equal to the white matter, a medium ADC (3 points); sADC greater than the white matter and less than the CSF, a high ADC (2 points); and sADC equal to the CSF, a very high ADC (1 point). Two experienced board-certified neuroradiologists reviewed both the PASL and ADC maps and scored each suspected glioma. The final tumor score was decided as a consensus of the 2 observers. We calculated each scoring system (sTP, sADC) and the combined scoring system (sTP + sADC) on the PASL and ADC maps for all suspected gliomas.
For the quantitative analysis, 1 observer placed 7 regions of interest (ROIs) in the tumors on the PASL and ADC maps manually: 3 ROIs were in the same area as the main mass, 3 ROIs were in the peritumoral area with lesions of high signal intensity on T2-weighted or FLAIR images, and 1 ROI was in the contralateral normal centrum semiovale. Each ROI measured 20 mm2. In patients with contrast-enhanced tumors, we placed the ROIs at the site of the enhanced lesions on contrast-enhanced T1-weighted MR images. In patients with weakly enhancing or nonenhancing tumors, we chose the ROIs after identifying the area of the tumor as one of hyperintensity on T2-weighted or FLAIR images. Cystic components were differentiated as both areas of hyperintensity on T2-weighted MR and hypointensity on FLAIR MR. Necrotic components were differentiated on contrast-enhanced T1-weighted images as the interior of enhanced lesions. Hemorrhagic lesions were differentiated on unenhanced T1-weighted MR images as areas of hyperintensity. We excluded cystic, necrotic, and hemorrhagic tumoral areas. We then calculated the ratio of the maximum tumor perfusion signal intensity (rTPmax) between the portion of the tumor and the contralateral normal area. We also calculated the minimum ADC value (mADC).
Five qualitative and quantitative parameters (sTP, sADC, sTP + sADC, rTPmax, and mADC) were analyzed in all suspected gliomas and compared with the pathologic tumor classification and grade.
Statistical Analysis
The sensitivity, specificity, PPV, and NPV were calculated for the correct identification of high-grade and low-grade gliomas. With 95% CI, we estimated the sensitivity and specificity by using standard statistical formulas on the basis of the consensus data from the qualitative analysis and quantitative measures. Receiver operator characteristic (ROC) curve analyses were used for the evaluation of diagnostic performance of PASL and ADC that declared a glioma to be high grade or low grade if, and only if, the qualitative and quantitative parameters for that suspected tumor were greater than or equal to some threshold value. This analysis permitted the determination of the sensitivity, specificity, PPV, and NPV associated with each parameter as a function of the threshold value used to identify high-grade and low-grade gliomas. We analyzed the ROC curve using the MedCalc statistical package (MedCalc Software, Mariakerke, Belgium). The areas under the ROC curves (AUC) were compared between the 5 PASL and ADC parameters. All P values were 2-tailed with .05 as the criterion for statistical significance. We used correlation coefficients to show the relationships among the 5 PASL and ADC parameters.
Results
Table 1 shows the demographic data of our patients. The 33 suspected gliomas in accordance with the WHO grading system consisted of 11 grade 2, 7 grade 3, and 15 grade 4 lesions.
Demographic data on the study patients
Diagnostic Accuracy of Conventional Images and Adjunctive PASL/ADC
On review of the conventional images alone, the 2 observers diagnosed accurate tumor grades (grades 2, 3, and 4) in 23 of 33 (70%) lesions on the basis of consensus reading. On review of the conventional image and adjunctive PASL/ADC, the 2 observers diagnosed accurate tumor grades (grades 2, 3, and 4) in 29 of 33 (88%) lesions. The differences in the diagnostic performance parameters for qualitative determination of high-grade and low-grade gliomas between the conventional images-only and the conventional images with adjunctive PASL and ADC are listed in Table 2.
Sensitivity, specificity, PPV, and NPV for conventional imaging and the five qualitative and quantitative methods of PASL and ADC for distinguishing high-grade from low-grade gliomas
Diagnostic Performance of PASL and ADC for Grading of Gliomas
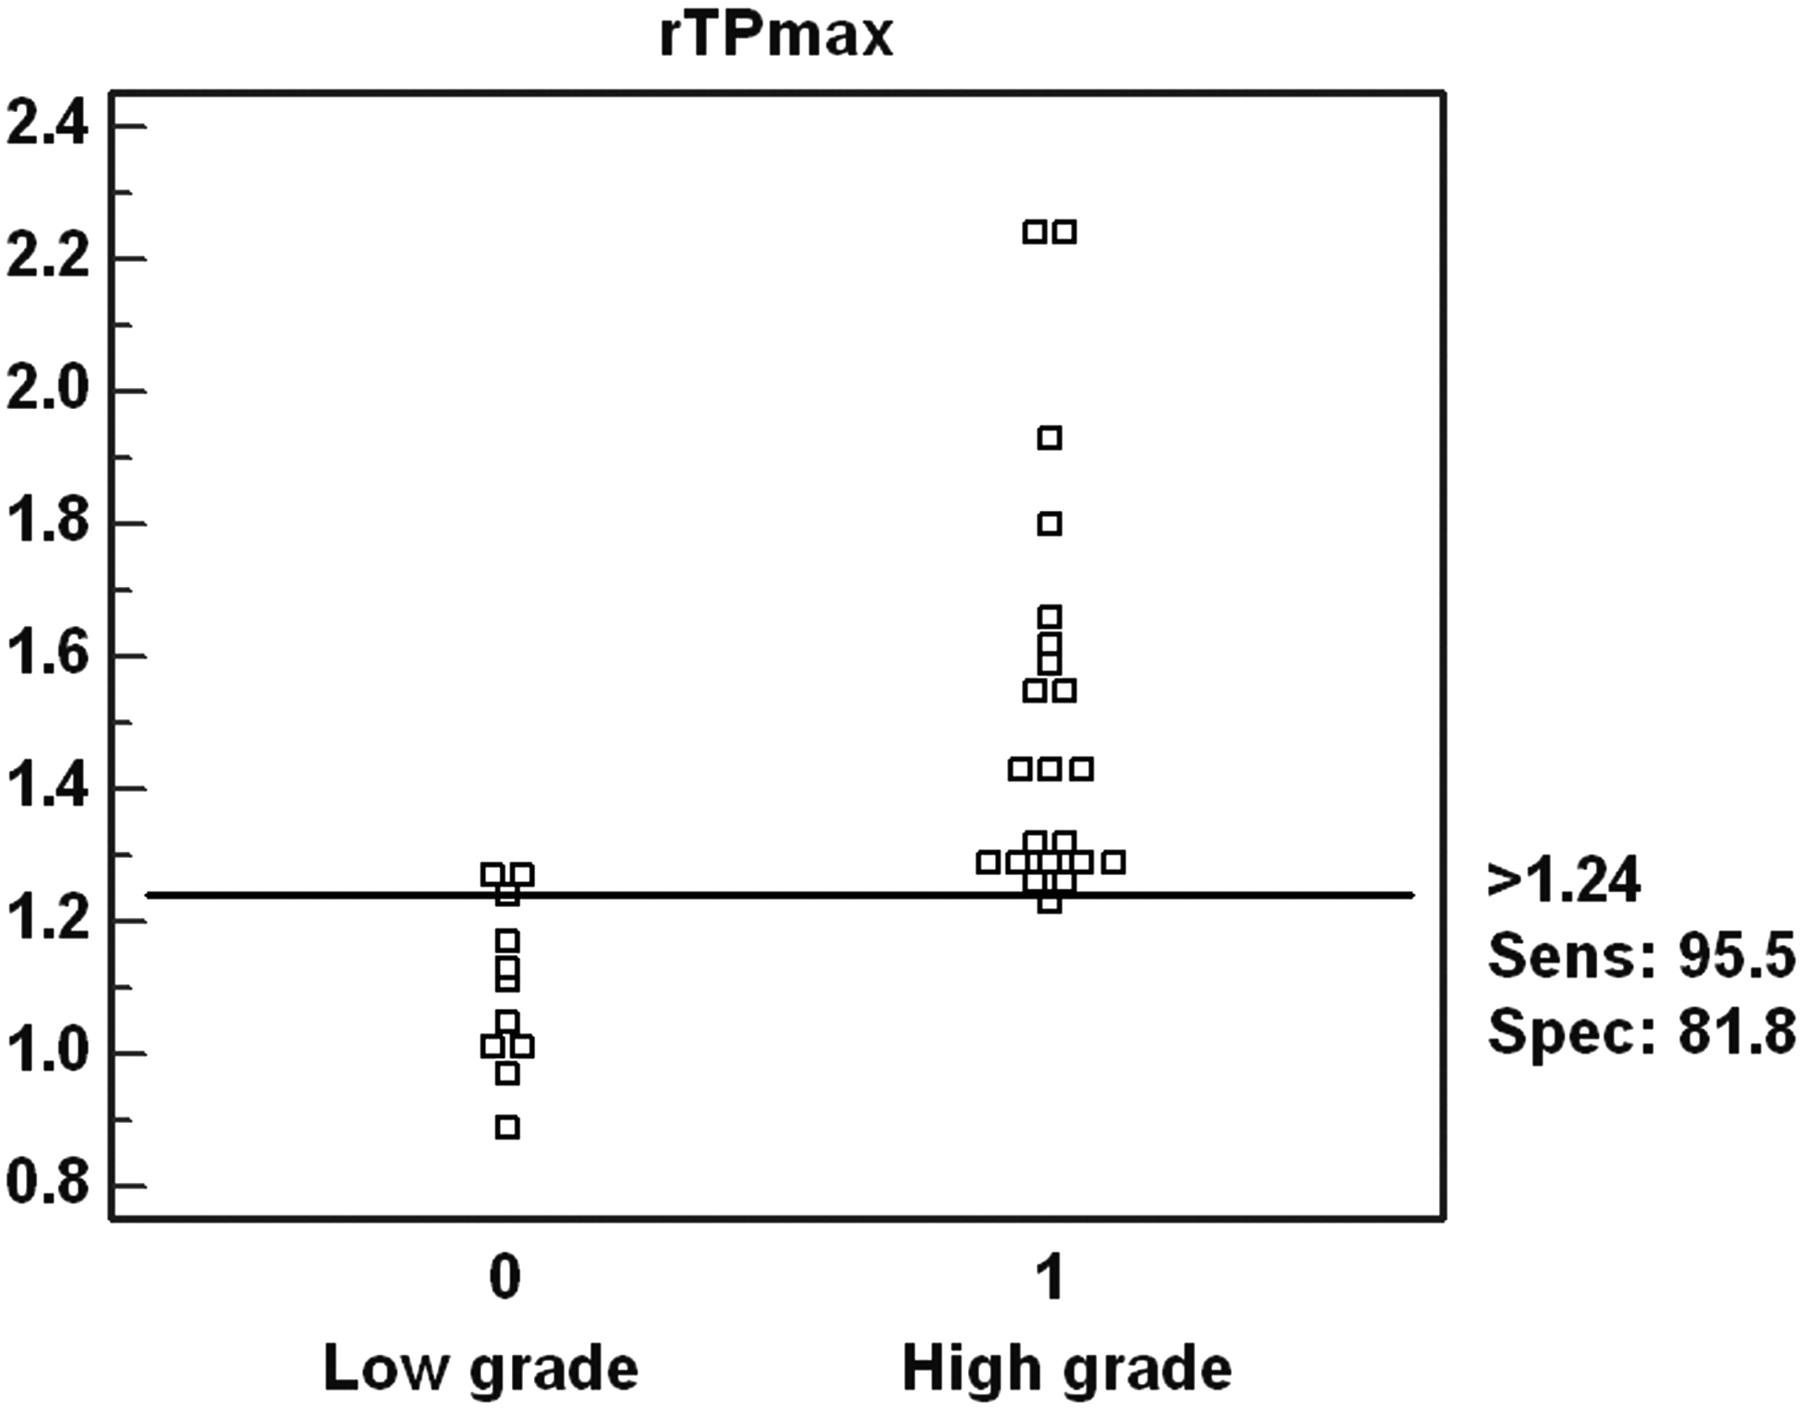
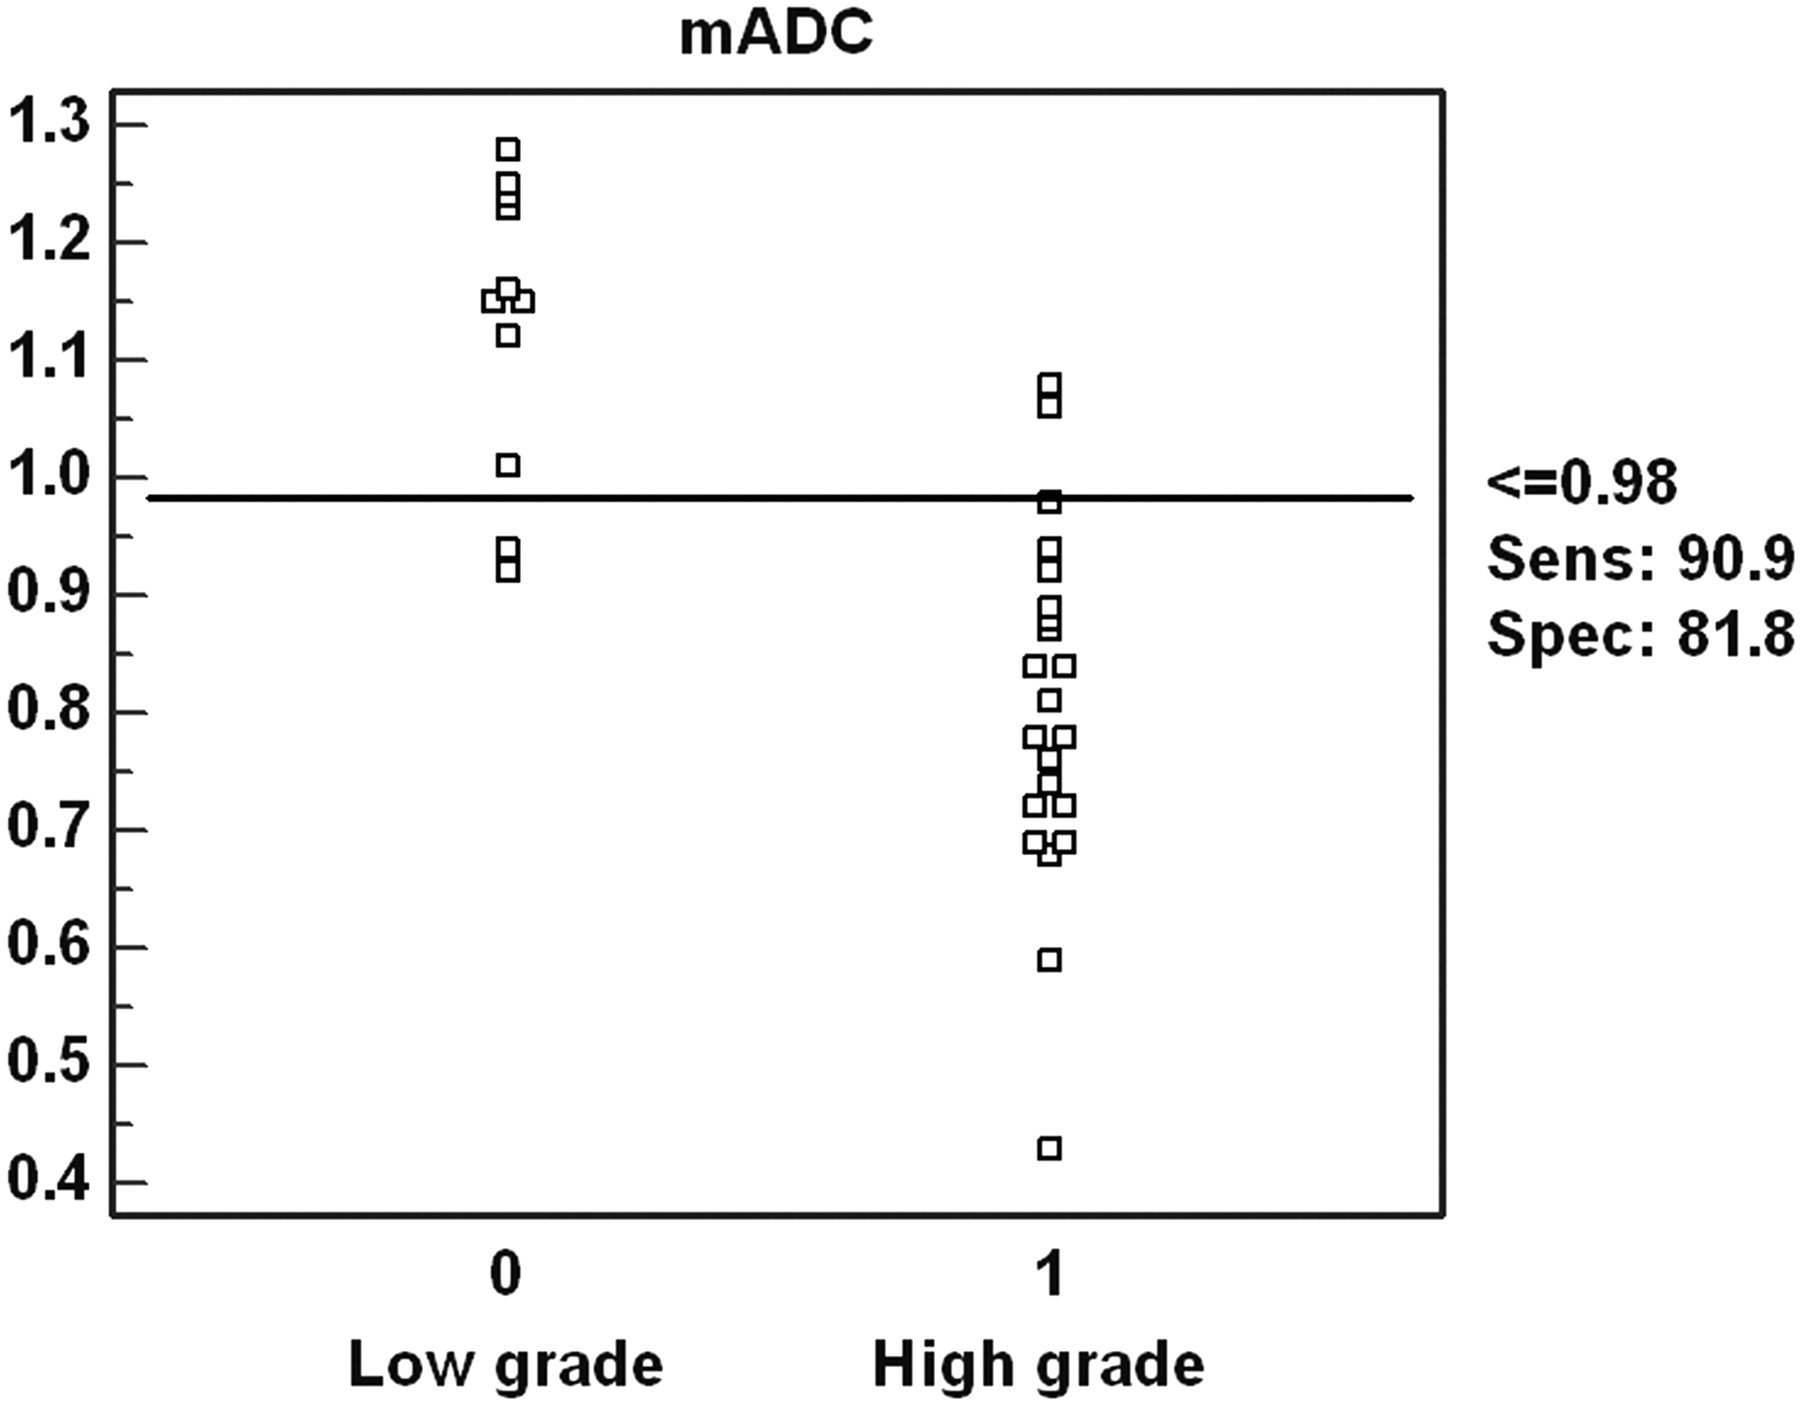
The sensitivity, specificity, PPV, and NPV for determination of glioma grading with sTP were 86.4%, 90.9%, 95.0%, and 76.9%, respectively (threshold value, 2). With sADC, the sensitivity, specificity, PPV, and NPV were 86.4%, 72.7%, 86.4%, and 72.7%, respectively (threshold value, 2) (Figs 1, 2). The combined sTP and sADC had a sensitivity, specificity, PPV, and NPV of 90.9%, 90.9%, 95.2%, and 83.3%, respectively (threshold value, 5). For rTPmax, statistical analysis gave a threshold value of 1.24 with a sensitivity, specificity, PPV, and NPV of 95.5%, 81.8%, 91.3%, and 90.1%, respectively (Fig 3). For mADC, statistical analysis yielded a threshold value of 0.98 × 10⁻³ mm/s2 with a sensitivity, specificity, PPV, and NPV of 90.9%, 81.8%, 90.9%, and 81.8%, respectively (Fig 4). Table 2 also shows the sensitivity, specificity, PPV, and NPV for the 5 different qualitative and quantitative methods for distinguishing high-grade from low-grade gliomas.

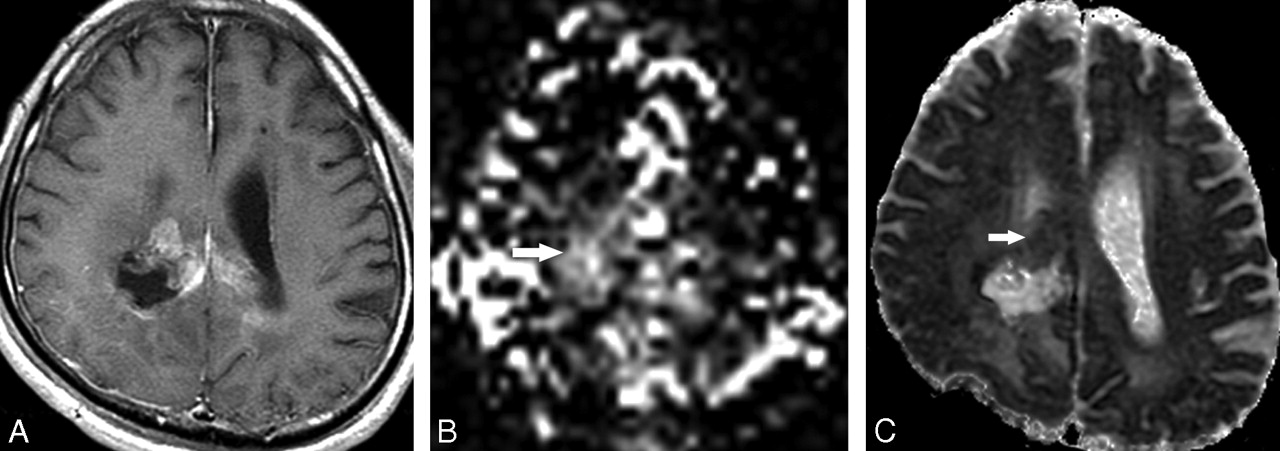
A 41-year-old man with a suspected recurred tumor after surgery. There is a contrast-enhancing lesion around the previous tumor resection site on contrast-enhanced T1-weighted axial image (A). Tumor perfusion score (sTP) on pulsed arterial spin-labeling map is 4 (B, arrow). Visual apparent diffusion coefficient score (sADC) is 3 (C, arrow); therefore, the combined sTP and sADC is 7. Initial imaging diagnosis was glioblastoma multiforme (grade 4); however, on pathologic examination this tumor was confirmed as an anaplastic astrocytoma (grade 3).

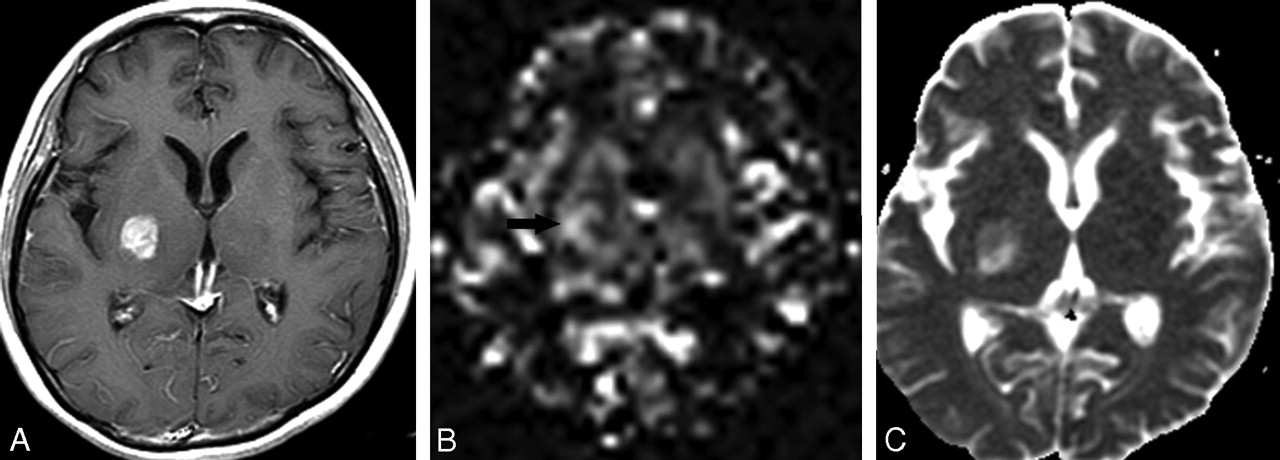
A 45-year-old woman with a suspected brain tumor in the right basal ganglia. Contrast-enhanced T1-weighted axial image shows enhancing mass in the right basal ganglia (A). Tumoral perfusion score (sTP) is 3 (B, arrow). The visual apparent diffusion coefficient score (sADC) is 2 (C); therefore, the combined sTP and sADC is 5. On pathologic examination, this tumor was confirmed as an anaplastic astrocytoma (grade 3).

Interactive dot diagram. The sensitivity and specificity for the determination of a glioma grade with the ratio of maximum tumoral perfusion signal intensity (rTPmax) were 95.1 and 81.8, with a threshold value of 1.24.

Interactive dot diagram. The sensitivity and specificity for the determination of a glioma grade with a minimum apparent diffusion coefficient value (mADC) were 90.9 and 81.8, with a threshold value of 0.98 × 10⁻³ mm/s2.
In the ROC curve analyses, the AUC of the quantitative PASL parameter (rTPmax) was the largest (0.97), and that of the qualitative ADC parameter (sADC) was the smallest (0.80) among the 5 quantitative and qualitative parameters. The AUC of the sADC was significantly smaller than the quantitative (rTPmax, mADC) and combined qualitative parameters (sTP + sADC). The difference of the AUC between the quantitative (rTPmax, mADC) and combined parameters (sTP and sADC) was not statistically significant (Fig 5).

The ROC curve of 2 quantitative (rTPmax, mADC) and 3 qualitative (sTP, sADC, sTP and sADC) parameters for glioma grading. The areas under the ROC curve for the 5 parameters are as follows: rTPmax, 0.97; sTP and sADC, 0.96; mADC, 0.93; sTP, 0.90; and sADC, 0.80.
Discussion
The current criterion standard for diagnosis and grading of a tumor is the histopathologic assessment, but this has limitations such as the inherent sampling error associated with a limited number of biopsy samples.7 The misdiagnosis of the grade of a tumor can have major therapeutic implications: high-grade gliomas misdiagnosed as low grade will be treated less aggressively than necessary, and low-grade gliomas misdiagnosed as high grade will be treated more aggressively than necessary. Concomitant increases in morbidity and mortality have occurred in both cases.1 The development of imaging techniques capable of accurately depicting tumor grades in vivo is important for determining the most appropriate treatment for glioma. An unfortunate choice of biopsy site or insufficiently large samples might result in an incorrect histologic diagnosis. In malignant gliomas, peritumoral edema, which can be seen with either CT or MR, is often reported to have infiltrating neoplastic cells.29
In our study, we could use PASL imaging and an ADC map for preoperative grading of gliomas. The preoperative knowledge of tumor grading may affect further treatment. We could establish not only significant differences but also clear-cut threshold values of qualitative and quantitative scoring in low-grade and high-grade gliomas. Furthermore, we found an adjunctive value of PASL and ADC scoring in the glioma grading compared with conventional images alone. On the whole, our results for the glioma grading with simple qualitative scoring agreed with the quantitative results and increased diagnostic accuracy compared with conventional images.
The specificity of combined sTP and sADC in the determination of a high-grade glioma in our study was 90.9%, which indicated a high true-negative rate and low false-positive rate. Hence, if the sTP and sADC scoring is more than 5, there is a high probability that the tumor will be a high-grade glioma. Conversely, when the sTP and sADC scoring is less than 5, the tumor is unlikely to be high-grade glioma. The relatively high sensitivity means that true-positive rates are relatively high and false-negative rates are correspondingly low. The high NPV (83.3%) is likewise a significant finding because gliomas with low PASL and ADC scoring (<5) are unlikely to have high-grade components. Hence, it is an excellent tool for excluding the presence of a high-grade glioma, an issue that often confronts the neuroradiologist and neuropathologist.
DSC MR perfusion methods, which allow the creation of cerebral blood volume (CBV) maps, are potentially useful in the characterization of tumors because tumor aggressiveness and growth are associated with both endothelial hyperplasia and endothelial neovascularization.30 Relative CBV measurements reliably correlate with tumor grade and histologic findings of increased vascularity of the tumor.31–33 On histologic and angiographic examinations, Sugahara et al34 correlated maximum relative CBV values in 30 patients, with mean values of 7.32, 5.84, and 1.26 for glioblastomas, anaplastic astrocytomas, and low-grade gliomas, respectively. Aronen et al35 found mean maximum relative CBV values of 3.64 and 1.11 in high-grade and low-grade gliomas, respectively (n = 19). Knopp et al32 had similar mean maximum relative CBV values of 5.07 and 1.44 in high-grade and low-grade gliomas, respectively (n = 29). Lev and Rosen36 used a relative CBV threshold value of 1.5 in discriminating among 32 consecutive patients with glioma. Thirteen (100%) of 13 astrocytomas were correctly categorized as high-grade gliomas.
With arterial spin-labeling, water is used as a freely diffusible intrinsic tracer. Arterial blood outside the imaging section is labeled with use of an inversion pulse. After the transit time from the labeling region to the imaging section, blood spins exchange with tissue water at the capillaries. Subtracting a control image without previous labeling leaves the transported magnetization only, and this process results in a perfusion-weighted image. CBF can be quantified with use of a general kinetic model, an adaptation of the Kety model of ASL described by Buxton et al37 The experience gained with ASL in brain tumors is limited. One study found a close correlation between ASL and first-pass bolus methods in the determination of blood flow in brain tumors. Both techniques observed the highest tumoral blood flow in patients with glioblastomas and metastases and were able to show heterogeneous distribution of blood flow within an individual tumor.19 Important practical advantages of ASL are the immediate availability of perfusion images and the ease of quantification without extensive postprocessing. Perfusion data can be obtained in a flexible manner and can be integrated into a conventional MR examination at any time as long as no contrast agent has been administered. The high perfusion and short blood circulation times in young patients and children result in a fairly good signal-to-noise ratio with the ASL studies. All of these features make this technique suitable for the diagnostic assessment of patients with brain tumors.
The reports for the correlation between ADC and grading of tumors are controversial. According to previous reports,38 the higher the tumor grade, the lower the ADC in glioneuronal tumors, especially astrocytic tumors. Therefore, the lowest ADC value should indicate the region of greatest cellularity and be helpful in selecting targets for biopsy. On the other hand, in another study by Castillo et al,21 the use of ADC values is questionable in patients with high-grade cerebral astrocytomas. On an individual basis, the ADC values overlapped considerably and were not useful in each patient. Other physiologic parameters may also affect diffusion flow, including regional hydrostatic and osmotic gradients, blood flow, and luminal surface area.39 Within tumors, the driving forces are affected by several factors, including the degree of edema and mass effect that create a “back pressure” and influence transmural pressure gradients. The interstitial fluid pressures may become elevated by leakage from adjacent blood vessels, decreased lymphatic clearance, and abnormal tissue biomechanical properties, all of which can lead to decreased hydrostatic gradients and to a greater relative role for diffusion.40 Tumor tissue heterogeneity in different tumor grades or within the same tumor can also make analysis difficult. Including ADC as a complementary index in a scoring system for grading of tumors may thus compound the total error in the final assessment.
PASL and DWI with ADC maps are available immediately after acquisition, with only minimal postprocessing. This availability is a clear advantage in a routine clinical setting; at our institution, these 2 imaging modalities are included in the routine brain tumor imaging protocol. We showed that combined PASL and ADC with use of a simple qualitative method of scoring allows reliable differentiation between low-grade and high-grade gliomas and improves the diagnostic accuracy compared with conventional images, as other investigators have shown with different advanced imaging techniques and quantitative methods. We obtained similar results for differentiation of tumors with qualitative and quantitative analyses of PASL and ADC maps.
The limitations of our study must be acknowledged. First, the PASL technique had several technical weaknesses in the evaluation of tumoral blood flow. PASL is not relatively fast compared with other techniques and may involve long imaging times. Compared with perfusion maps obtained with contrast injection, they have several disadvantages including limited number of sections, lower resolution, and no permeability maps. With marked variability in the size of the tumor vessel as a result of tumoral angiogenesis, measurements of PASL blood flow may become inaccurate in certain tumoral regions with low or high flow rates. In comparison, contrast-enhanced perfusion imaging remains sensitive to the total vascular bed. Comparing tumoral blood flow with the age-dependent mean perfusion as a ratio may be more important than using the absolute tumoral blood flow.19 Second, a major problem existed with our study design. We did not perform any precise stereotactic histopathologic correlation with our imaging study. We were aware that these tumors were extremely variable from a histopathologic standpoint. Third, an uneven distribution of the grades of the tumors was available for our analysis; for example, only a few grade 3 tumors were analyzed. For practical purposes, we grouped patients with anaplastic astrocytoma and glioblastoma multiforme together. Further studies with a larger population are necessary to determine the usefulness of qualitatively analyzing both PASL and ADC in differentiating these tumors. A fourth potential limitation of our study was the semi-quantification of the maximum tumoral perfusion signal intensity ratio (rTPmax) with use of an internal reference method within the same voxel. Although 7 ROIs were manually placed in the tumor and in normal areas, the effects of tumoral heterogeneity and regional differences in tumoral perfusion were difficult to assess.
Conclusion
The PASL and ADC maps are available immediately after acquisition, with only minimal postprocessing. Qualitative measurement with PASL and ADC in combination can significantly improve the sensitivity and predictive values of preoperative grading of gliomas compared with conventional imaging alone. The combined application of PASL and ADC is feasible as part of the routine brain tumor imaging protocol.
References
- Received March 30, 2006.
- Accepted after revision March 26, 2007.
- Copyright © American Society of Neuroradiology
In this issue


Jump to section
Related Articles
Cited By...
- Arterial Spin-Labeling in Children with Brain Tumor: A Meta-Analysis
- 3D Pseudocontinuous Arterial Spin-Labeling MR Imaging in the Preoperative Evaluation of Gliomas
- MR Imaging-Based Analysis of Glioblastoma Multiforme: Estimation of IDH1 Mutation Status
- Arterial Spin-Labeling Perfusion MRI Stratifies Progression-Free Survival and Correlates with Epidermal Growth Factor Receptor Status in Glioblastoma
- MRI Grading versus Histology: Predicting Survival of World Health Organization Grade II-IV Astrocytomas
- Comparison of Multiple Parameters Obtained on 3T Pulsed Arterial Spin-Labeling, Diffusion Tensor Imaging, and MRS and the Ki-67 Labeling Index in Evaluating Glioma Grading
- The Added Value of Apparent Diffusion Coefficient to Cerebral Blood Volume in the Preoperative Grading of Diffuse Gliomas
- Does MR Perfusion Imaging Impact Management Decisions for Patients with Brain Tumors? A Prospective Study
- Quantitative Blood Flow Measurements in Gliomas Using Arterial Spin-Labeling at 3T: Intermodality Agreement and Inter- and Intraobserver Reproducibility Study
- Isolated Diffusion Restriction Precedes the Development of Enhancing Tumor in a Subset of Patients with Glioblastoma
- Apparent Diffusion Coefficient of Glial Neoplasms: Correlation with Fluorodeoxyglucose-Positron-Emission Tomography and Gadolinium-Enhanced MR Imaging