
Abstract
BACKGROUND AND PURPOSE: Lesion volume change (LVC) assessment is essential in monitoring MS progression. LVC is usually measured by independently segmenting serial MR imaging examinations. Subtraction imaging has been proposed for improved visualization and characterization of lesion change. We compare segmentation of subtraction images (SSEG) with serial single time-point conventional segmentation (CSEG) by assessing the LVC relationship to brain atrophy and disease duration, as well as scan-rescan reproducibility and annual rates of lesion accrual.
MATERIALS AND METHODS: Pairs of scans were acquired 1.5 to 4.7 years apart in 21 patients with multiple sclerosis (MS). Scan-rescan MR images were acquired within 30 minutes in 10 patients with MS. LVC was measured with CSEG and SSEG after coregistration and normalization. Coefficient of variation (COV) and Bland-Altman analyses estimated method reproducibility. Spearman rank correlations probed associations between LVC and other measures.
RESULTS: Atrophy rate and net LVC were associated for SSEG (R = −0.446; P < .05) but not when using CSEG (R = −0.180; P = .421). Disease duration did not show an association with net lesion volume change per year measured by CSEG (R = −0.360; P = .11) but showed an inverse correlation with SSEG-derived measurements (R = −0.508; P < .05). Scan-rescan COV was lower for SSEG (0.98% ± 1.55%) than for CSEG (8.64% ± 9.91%).
CONCLUSION: SSEG unveiled a relationship between T2 LVC and concomitant brain atrophy and demonstrated significantly higher measurement reproducibility. SSEG, a promising tool providing detailed analysis of subtle alterations in lesion size and intensity, may provide critical outcome measures for clinical trials of novel treatments, and may provide further insight into progression patterns in MS.
MR imaging has evolved as a core paraclinical tool for the diagnosis, longitudinal monitoring, and scientific investigation of multiple sclerosis (MS). Subsequent to documenting disease effects at 1 time point, assessing longitudinal change has evolved as the dominant role of MR imaging. In particular, quantification of MR imaging lesion burden has served an important role in the evaluation of MS progression and treatment effects.1–5 As the expected average annual change in T2 hyperintense lesion volume has been reported to be only 5%–10%,6 the sensitivity of quantitative analysis of lesion burden change is paramount. Established methods for evaluating the change in T2 lesions include manual counting of total, new, enlarging, and resolving lesions7 and quantitative segmentation of total lesion load at each time point.8–17
Direct segmentation of lesion change based on subtraction of coregistered serial MR images has not yet been extensively studied. This approach promises to be a more robust and sensitive alternative for measuring disease progression on serial MR imaging scans, because it focuses quantification efforts on the subset of lesions showing change, which frequently represent a very small fraction of all lesions.
Subtraction imaging, which cancels stable disease, provides enhanced sensitivity to characterize lesions by separately identifying new, enlarging, and resolving MS lesions.7,18 The segmentation of subtraction images quantifies the new, enlarging, and resolving MS lesions seen on subtraction imaging.
In this article, we assessed the sensitivity of 2 image analysis strategies: conventional segmentation followed by the determination of numeric differences between total lesion volumes at each time point (CSEG) versus the segmentation of subtraction images (SSEG). We compared the average yearly change in MS lesion burden using each of these 2 methods and determined measurement precision. By way of external validation, we related the 2 change measures with changes in brain parenchymal fraction (BPF) and disease duration.
Materials and Methods
Patient Selection and Imaging Parameters
Twenty-one patients with MS who had at least 2 MR imaging examinations were selected from a retrospective data base, without knowledge of clinical characteristics or imaging findings. Dual-echo proton density/T2-weighted MR images (TE = 30/80 ms; TR = 3000 ms; 192 phase-encoding steps; 0.93 × 0.93 × 3 mm3 nominal voxel size; with no intersection gaps) had been acquired on a 1.5T MR system (Signa; GE Medical Systems, Milwaukee, Wis) using a standard circular polarized head coil. To test reproducibility, we also obtained previously acquired pairs of scan-rescan MR imaging examinations from a separate group of 10 patients with MS in which the same MR imaging protocol and platform had been used. Each scan-rescan pair had been performed within 30 minutes. Patients were removed from the MR room after the first scan and then repositioned by a different technologist.9 All of the data were obtained in conformity with institutional review board-approved protocols.
Conventional Image Segmentation: Lesions (CSEG Method) and BPF Calculation
Template-driven segmentation plus partial volume effect correction was applied to all of the sets of dual-echo images and yielded maps for normal and abnormal (lesion) white matter (WM), gray matter (GM), and CSF.8,10,19 Lesion segmentation results were manually edited by an expert radiologist to obtain total lesion volumes for each time point. The total lesion volumes from the 2 points were arithmetically subtracted to obtain the lesion volume change with the CSEG method. BPF, a surrogate marker of whole-brain atrophy, was defined as the ratio of brain parenchyma (WM + GM) volume to intracranial cavity (ICC) volume, that is, BPF = 1 −CSF/ICC.20
Subtraction Image and Its Segmentation (SSEG)
Each pair of proton attenuation-weighted serial images (Fig 1) were coregistered, intensity normalized, and subtracted to produce “change maps.”7 The second time point was registered to the first time point by using the registration algorithm in the SPM2 package (Wellcome Department of Imaging Neuroscience, London, UK; by using cubic interpolation and 6 df).21,22

Subtraction of PD images from a 45-year-old male patient with MS scanned at an interval of 4.7 years shows resolving (white arrow and arrowhead), new (black arrowhead), and enlarging (black arrows) lesions. Left column, Baseline MR image. Middle column, Coregistered second time-point MR image. Right column, Subtraction image (time point 2 minus baseline). Subcortical resolving lesion and deep WM resolving lesion in the subtraction image are shown with a white arrowhead and white arrow, respectively. Subtle artifacts are seen on the boundary of the brain surface due to slight misregistration. (In all of the images, the skull has been stripped by masking with ICC.)
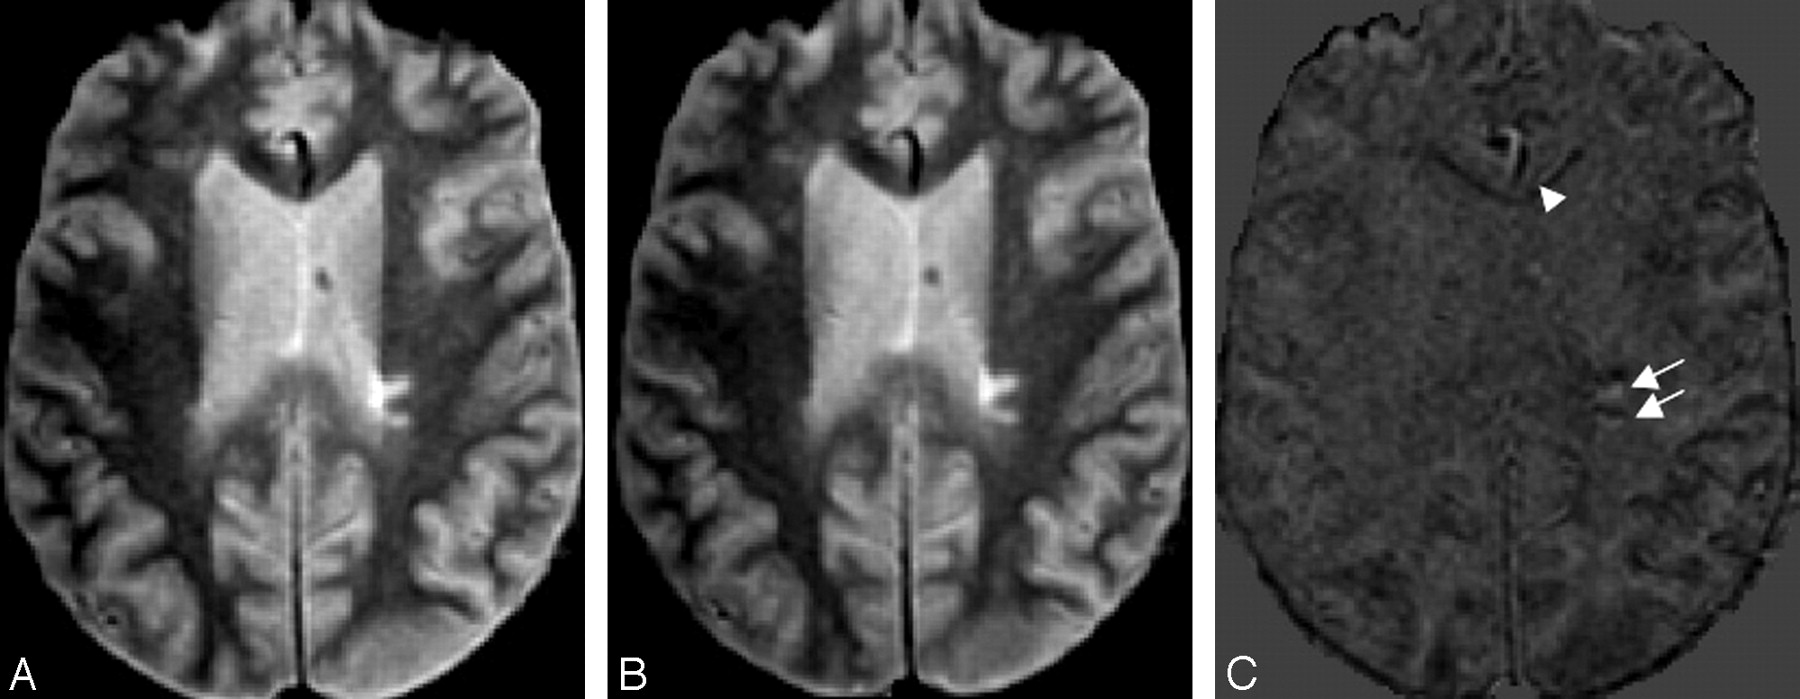
To reduce partial volume artifacts from anisotropic voxel size and to reduce the interpolation effects generated by resampling the second MR imaging scan to the first one, we used a 3D Gaussian filter with an SD of 0.68 and a kernel size of 3 × 3 × 3 pixels.23 An artifact specific to subtraction imaging arises from partial volume effects, anisotropic voxel size, patient repositioning, and patient motion: it shows counterposed white and black borders on the lesion periphery. We defined this as “Yin-Yang artifact” (Fig 2). Recognition of this artifact served as an internal standard to identify misregistration errors. Lesions displaying the Yin-Yang artifact on subtraction images were excluded from quantitative analysis.

Yin-Yang artifact: scan-rescan MR images from the same day. Left column, Baseline image (scan). Middle column, Coregistered second time-point image (rescan). Right column, Subtraction image (rescan-scan). Yin-Yang artifacts are shown (white arrows) in the subtraction image (right column). An artifact from vessel misregistration is shown (white arrowhead) in the subtraction image. (In all of the images, the skull has been stripped by masking with ICC.)
New, enlarging, or brightening lesions resulted in hyperintense signal intensity on subtraction images, whereas disappearing, shrinking, or darkening lesions resulted in hypointense signal intensity compared with unchanging brain parenchyma (Fig 1).7 In this work we did not quantify lesion darkening or brightening in the absence of volumetric change, because this could not be validated with respect to CSEG and would have transcended the scope of this analysis. Lesion change needed to be greater than or equal to 4 pixels per section and confirmed on at least 2 contiguous sections. This study focused only on lesions of which the diameter was equal to or greater than 3 mm; smaller lesions were manually removed using an island removal tool.
The images were displayed in the 3 orthogonal views, and lesions were identified on the subtraction images by 3 experienced readers in consensus. Lesions were then segmented using a semiautomated approach: each lesion was manually encapsulated by a 3D box region of interest followed by automated thresholding (Otsu's) and manual editing. For the purpose of comparison, both methods, CSEG and SSEG, can be considered as manual lesion segmentation, albeit from single versus subtraction image data, respectively. The motivation of expert editing was to minimize bias because of the choice of a particular segmentation algorithm.
Statistical Analysis and Outcome Analysis
To compute the reproducibility of the CSEG and SSEG methods, we analyzed the lesion volume differences (absolute value) in the scan-rescan group (10 patients) using the coefficient of variation (COV) and the Bland-Altman method.24 For the CSEG method, the Bland-Altman analysis was performed by comparing the lesion volume measurements from the scan-rescan group. For the SSEG method, the Bland-Altman analysis was performed by using the baseline lesion volume (measured with CSEG) and the sum of the baseline lesion volume and the net change in lesion volume measured by the SSEG method. The same strategy was used to calculate the interscan COVs (defined as the ratio between the SD and the mean). A Wilcoxon test was performed to test the significance of the difference in results of CSEG and SSEG.
For the group of 21 patients with MS, Spearman rank correlation coefficients were calculated for the following 4 pairs of variables: 1) net BPF change and net lesion volume change; 2) annual BPF change and net lesion volume change per year; 3) interval time between MR imaging scans and net lesion volume change; and 4) disease duration and the net lesion volume change per year.
Results
Clinical and MR Imaging Characteristics of Patients in This Study
The 21 patients with MS in the longitudinal study had a mean age of 43.6 years and included 17 women and 4 men. Twenty patients were categorized as having a relapsing-remitting (RR) disease course, whereas only 1 patient was in the secondary-progressive phase. The mean ± SD for disease duration (interval between first symptom and last MR imaging examination) was 10.27 ± 6.85 years (range: 5–28.8 years). Each patient was imaged twice during routine clinical surveillance with an interscan interval of 1.5 to 4.7 years (mean ± SD = 3.1 ± 0.89 years).
The average baseline lesion volume of the 21 patients with MS was 4.855 cm3, and the average baseline BPF was 0.877. The average change in the BPF was −0.007, corresponding with an average yearly atrophy rate of −0.0024.
Lesion Volume Change Measurements with SSEG and CSEG
The average changes in the net lesion volumes measured with the CSEG and SSEG method were 0.870 ± 1.635 cm3 (median, 0.180) and 1.16 ± 1.564 cm3 (median, 0.670), respectively. Although the mean net lesion volume change estimate was 33% higher with SSEG than with CSEG, these volumes were not statistically different (P = .14, Wilcoxon test). The yearly lesion volume change estimated by using SSEG was 28% higher than that measured with CSEG (0.356 ± 0.448 versus 0.278 ± 0.473). However, these lesion volume changes were not statistically different (P = .18, Wilcoxon test).
The yearly percentage lesion volume change relative to baseline was 11.2% (median, 5.4%) for CSEG and 26.7% (median, 13.1%) for SSEG (in both cases the baseline lesion volume was derived form CSEG). These measurements were statistically different (P < .05, Wilcoxon test).
In Fig 3, the lesion volume changes measured for each patient with the CSEG and SSEG methods are depicted. CSEG can only measure net change in lesion volume. In contrast, SSEG provides information about the volume change in new, enlarging, and resolving lesions (Fig 3).

Positive, negative, and net changes from pairs of subtraction images: the discriminatory power of SSEG. Change measurements obtained from pairs of dual-echo images using CSEG and SSEG methods are depicted. A, Patient-by-patient representation of lesion volume changes measured with SSEG and CSEG in pairs of dual-echo MR images from 21 patients with MS. The CSEG method can only measure the net change in lesion volume (black bar in each patient). In contrast, the SSEG method provides information about the volume change in new (red bars), enlarging (yellow bars), and resolving lesions (blue bars), as well as yielding a net lesion volume change (sum of new and enlarging lesion volumes minus resolving lesion volume; green bars). B, The average lesion volume changes measured with the CSEG and SSEG methods are shown. Greater average net lesion volume change is measured with the SSEG method, although no statistically significant difference is found in the net lesion volume change measured with both methods (P = 0.14, Wilcoxon test).
The average new, enlarging, and resolving lesion volumes measured with the SSEG method were 0.571 cm3, 0.812 cm3, and 0.222 cm3, respectively. Qualitative advantages of SSEG, such as the improved identification and measurement of cortical GM and subcortical changes, were also apparent (Figs 5 and 6). Manual editing of image segmentation varied significantly as a function of total plaque burden (particularly with CSEG). The CSEG manual time commitment for an experienced radiologist (Y.D.) ranged from a couple of hours to 1–2 days per case, depending on the lesion burden. The average manual correction of the novel SSEG application was generally 1–2 hours, because outlining was limited to the relatively small subset of lesions showing change.
Reproducibility Analysis
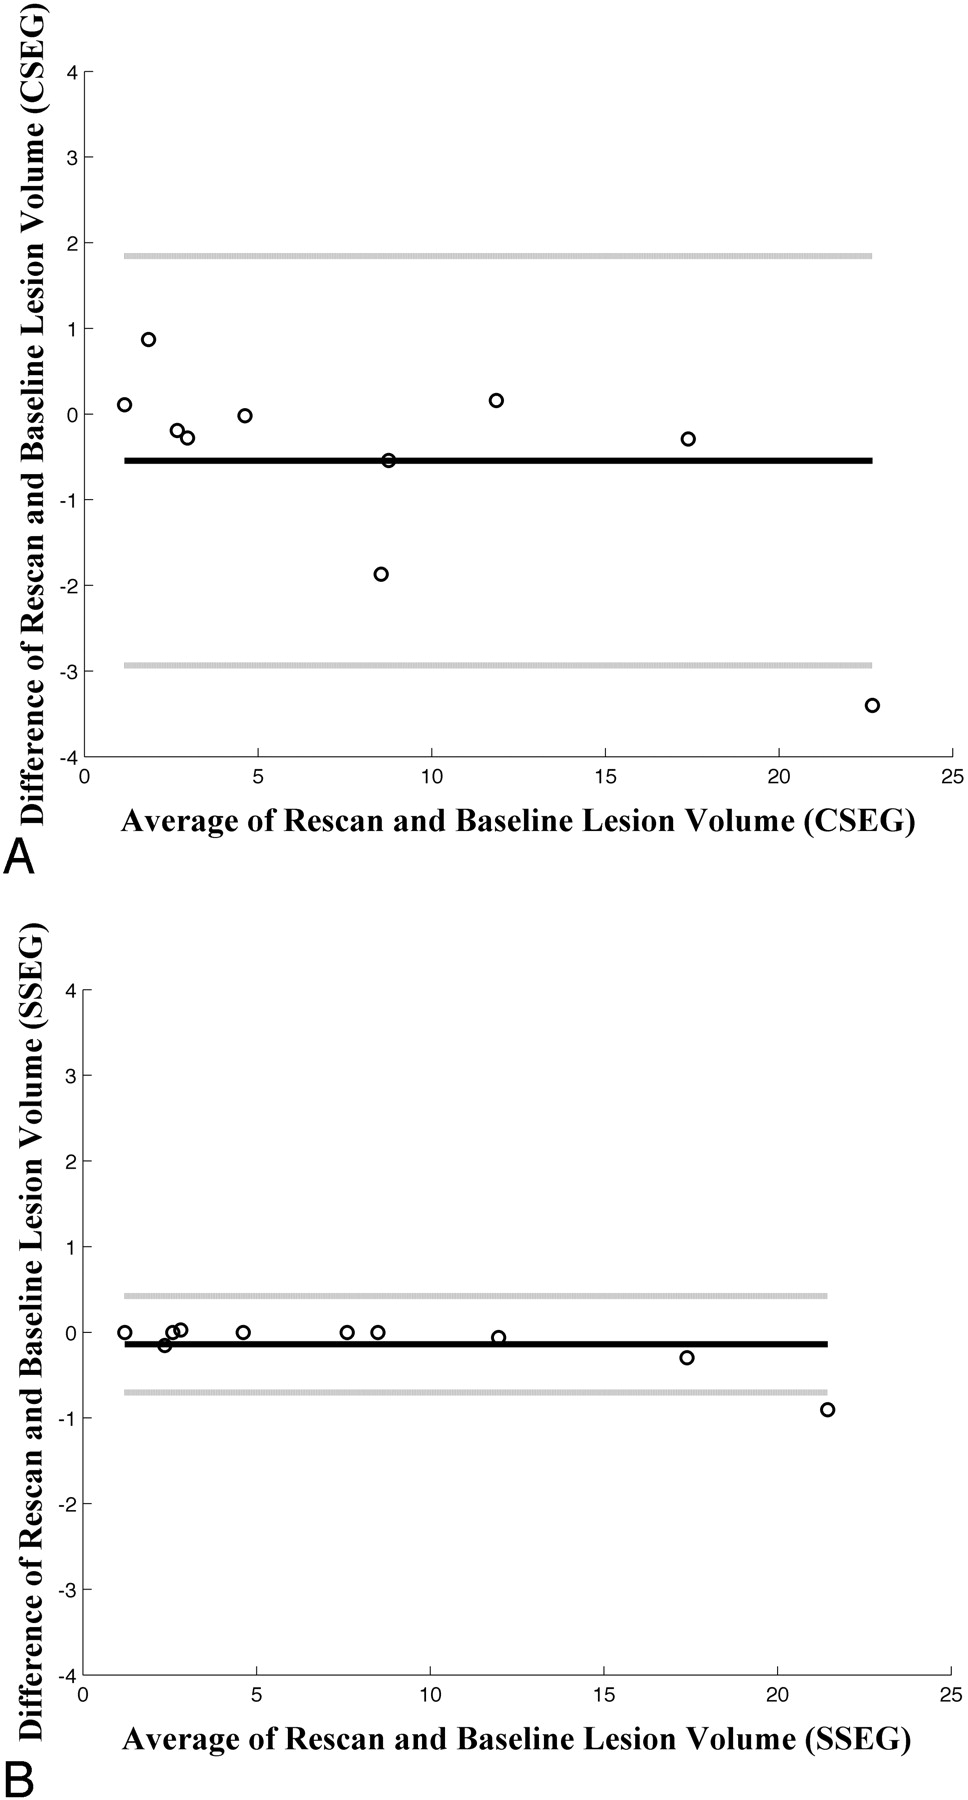
For the scan-rescan group (n = 10; Table 1), the baseline lesion volume was 7.98 ± 6.8 cm3. The rescan lesion volumes measured with the CSEG and SSEG methods were 8.50 ± 7.66 cm3 and 8.12 ± 7.08 cm3, respectively. The average lesion volume error (absolute values of difference between paired measurements) was significantly lower for SSEG (0.14 ± 0.28 cm3) than that for CSEG (0.77 ± 1.1 cm3; Wilcoxon test, P < .05). Expressed as a percentage of baseline lesion volume, the error of the SSEG (1.50 ± 2.30%) was also significantly lower than that of the CSEG (11.40% ± 12.00%; Wilcoxon test, P < .05). The scan-rescan COV was lower for SSEG (0.98% ± 1.55%) than for CSEG (8.64% ± 9.91%). Figure 4 shows Bland-Altman plots for the lesion volume change (LVC) measured with SSEG and CSEG on this scan-rescan group.

Reproducibility of SSEG and CSEG methods: Bland-Altman analysis in 10 patients (scan-rescan group). The solid line and the 2 dotted lines represent the mean ± 1.96 SD (95% confidence interval) of the difference of rescan lesion volume and baseline lesion volume, respectively. For both measurements, we use the same baseline lesion volume measured by CSEG. A, For the CSEG measurement, we used the baseline and rescan lesion volumes. B, For the SSEG measurement, the rescan lesion volume is the sum of baseline lesion volume (measured by CSEG) and the net change in lesion volume measured by the SSEG method. We see that the SSEG method has smaller confidence intervals, which indicate greater reproducibility.
Scan-rescan group lesion volume and interscan coefficient of variation
External Validation: Correlations between LVC Measures, BPF, and Disease Duration
Table 2 summarizes relevant associations between LVC measurements and other measures. The net LVC measured with SSEG showed moderate correlation (R = −0.446; P < .05) with the net BPF change, whereas the net LVC measured with the CSEG method did not show any association (R = −0.180; P = .421). The annualized LVC measured with the SSEG method demonstrated a significant correlation with disease duration (R = −0.508; P < .05) and approached significance in its association with annualized rate of brain atrophy (R = −0.430; P = .055). In contrast, CSEG measures of annual LVC showed no association with disease duration or annual rates of change in BPF. No significant relationship was detected between LVC and the time interval between scans.
Correlation coefficients between clinical measurements and net lesion volume change and annual lesion volume change per year
Discussion
Subtraction imaging has been used to analyze lesion change in MR imaging of patients with MS.7,18,25 However, to our knowledge, lesion change has not been quantified directly on subtraction images, which are typically analyzed by visual observation. The results of this study demonstrate that, compared with CSEG, SSEG has higher sensitivity and improved characterization by distinguishing between new, enlarging, and resolving lesions. Assessing only the net lesion volume change can be misleading. In those patients who had resolving lesions, the level of new lesion accrual can be significantly underestimated (eg, patients 1, 2, and 6 in Fig 3). A particularly striking example of this is patient 1, where net lesion volume change was close to 0, suggesting disease quiescence, whereas in fact SSEG demonstrated “balanced” positive and negative alteration in lesion burden. In addition, the SSEG method provided enhanced sensitivity to cortical and subcortical lesions, whereas CSEG was relatively insensitive to these subtle lesions (Figs 5 and 6). These lesions have also been shown to be the most difficult to detect visually using conventional surveillance techniques.26

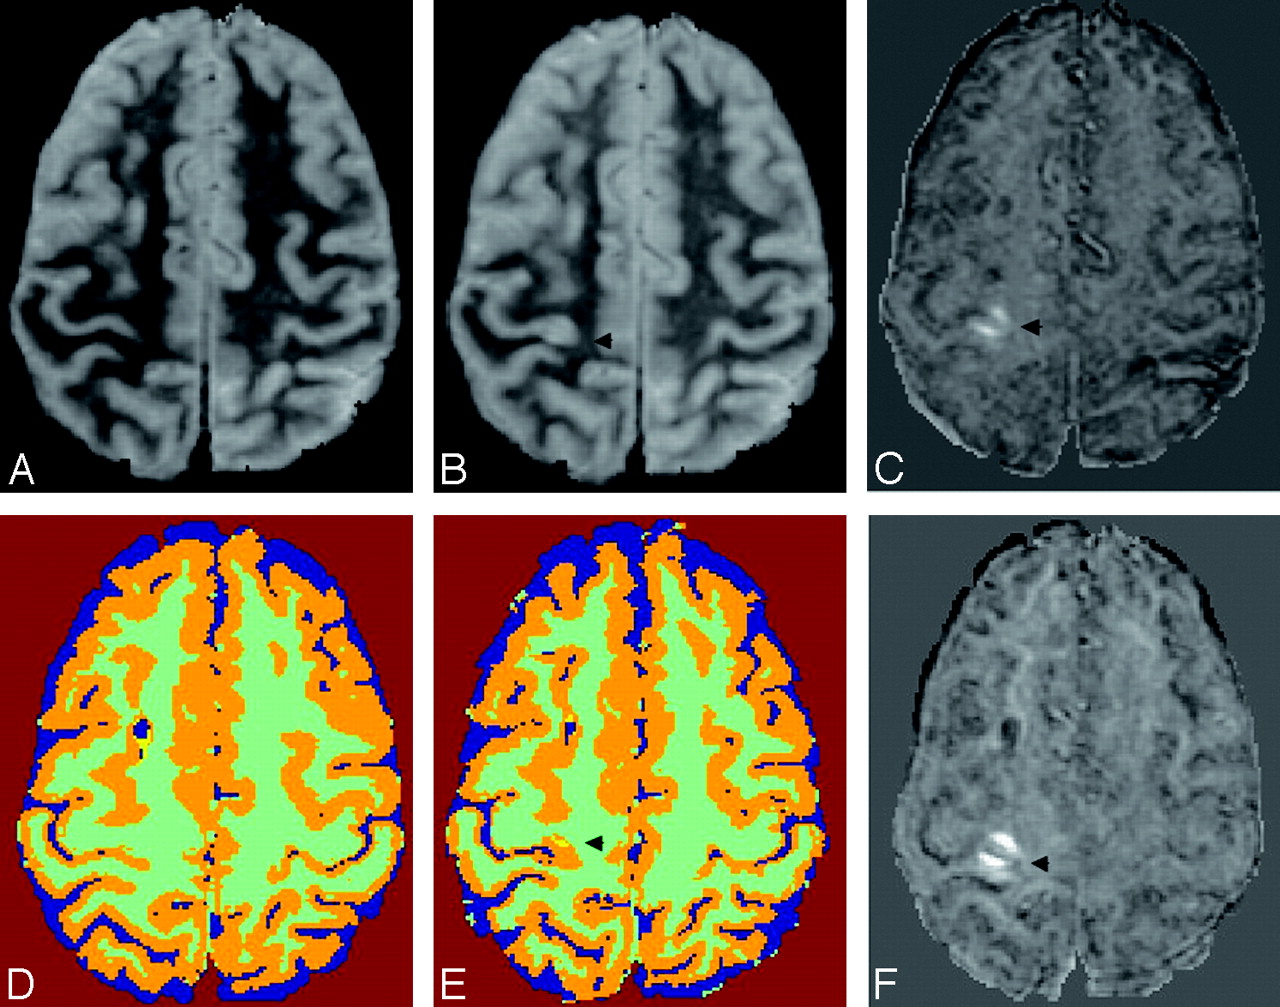
A juxtacortical lesion in a 44-year-old female patient with MS scanned at an interval of 3 years. A new juxtacortical lesion (arrow), difficult to appreciate on the native images and missed by CSEG, is clearly visible on the subtraction image (C) and SSEG (F). Baseline image (A) and its CSEG (D); Coregistered second time-point image (B) and its CSEG (E). The CSEG images were coregistered in this example to allow direct comparison. The CSEG method (D and E) segments CSF (blue), GM (orange), lesion (yellow), and WM (green); and SSEG method (F) only segments new lesion (pink). Subtle artifacts are seen on the boundary of the brain surface due to slight misregistration. (In all of the images, the skull has been stripped by masking with ICC.)

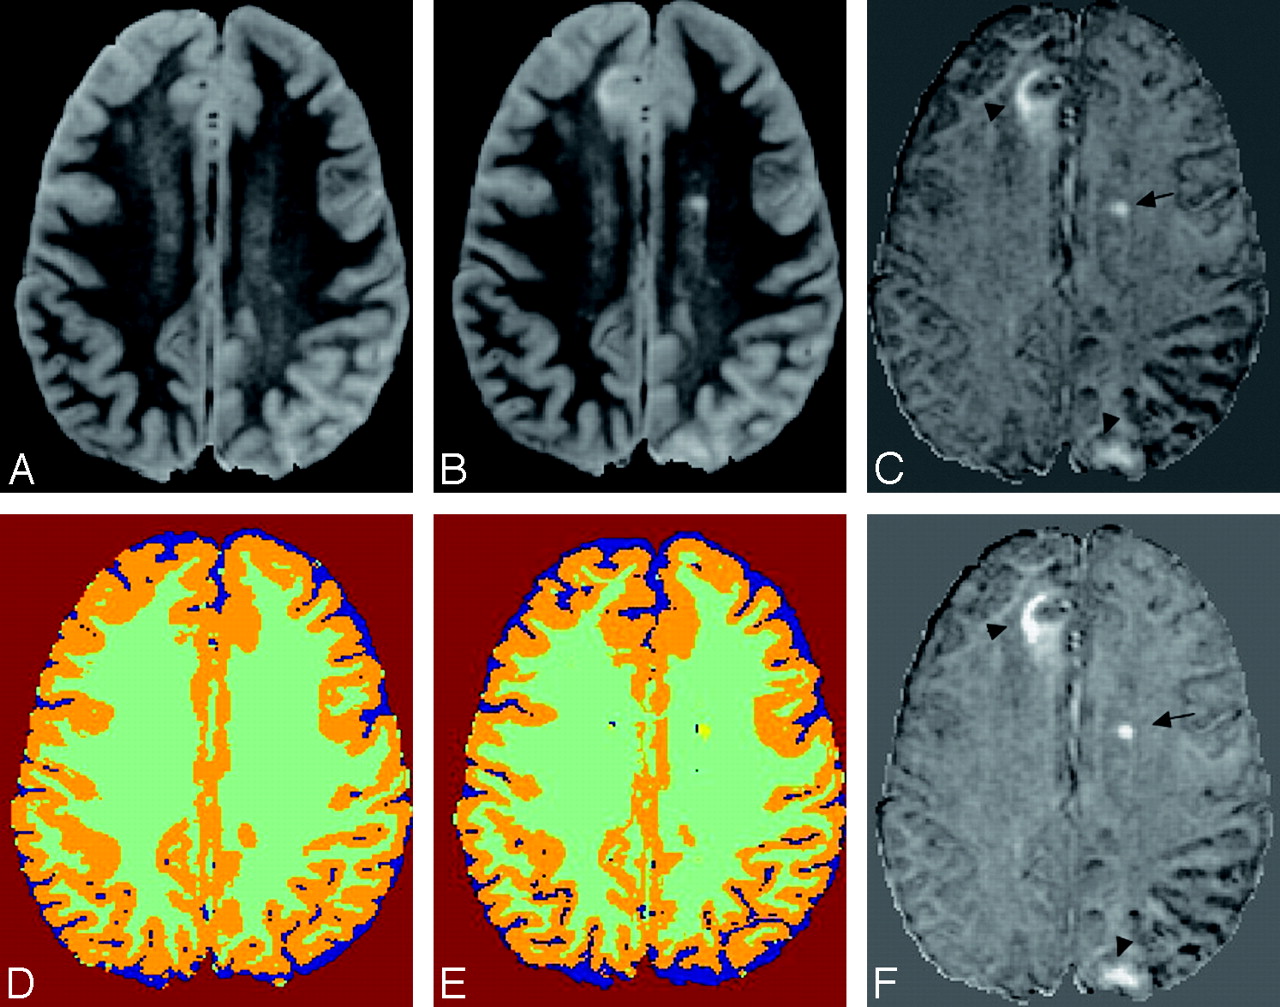
Two new cortical lesions and a new deep WM lesion in a 44-year-old female patient with MS scanned at an interval of 3 years. Baseline image (A) and its CSEG (D). Coregistered second time-point image (B) and the registered CSEG (E). Subtraction image (time point 2 minus baseline (C) and its SSEG (F). Two cortical lesions (arrowheads) are misclassified as normal GM with the CSEG method, but the subtraction image clearly shows these lesions. In addition, a new lesion is seen in the left preventricular deep WM (arrow). The CSEG method (D and E) segments CSF (blue), GM (orange), lesion (yellow), and WM (green); and SSEG method (F) only segments new lesions (pink). Subtle artifacts are seen on the boundary of the brain surface due to slight misregistration. (In all of the images, the skull has been stripped by masking with ICC.)
The patient sample in the longitudinal portion of the study was skewed toward patients in the later relapsing-remitting (RR) phase of MS (mean disease duration, 10.27 years), with relatively slow progression as measured by BPF. Their average BPF at baseline was in the reference range (0.877) relative to the patient's average age, and the average annualized rate of atrophy (−0.0024 per year) was consistent with published data of patients treated with disease-modifying therapy (DMT) and approximately 5 times lower than that of DMT-untreated patients in a natural history study in which BPF had been analyzed with a technique comparable to the one used in this work.27,28 Although the assessment of treatments transcends the scope of this work, it is likely that the relatively well-conserved brain parenchyma and the low rates of BPF change are reflective of the current era of DMT in MS (all of the scans were performed between 1997 and 2005).
The annual median LVC observed with CSEG was 5.37% and 13.12% with SSEG. Molyneux et al29 reported a median annual LVC of 12.5% in untreated RR patients, whereas the patients in the placebo group of the Interferon β-1a Trial1 had 5%–10% change, and the Prevention of Relapses and Disability by Interferon β-1a Subcutaneously in Multiple Sclerosis clinical trial30 had a median LVC of 10.9% over the 2 years of the study, corresponding with an annualized rate of 5.45%. Lee et al25 explored a conventional image segmentation strategy (local thresholding) on coregistered images and reported an annual LVC of 10.3% in 19 patients with MS while demonstrating that new LVC detected from a single pair of images obtained at a 1-year interval was well correlated to the summation of new gadolinium-enhancing lesions in intervening T1-weighted scans obtained every 3 months (r = 0.72; P = .001). The CSEG method, which is similar to the approaches used to estimate LVC in those studies, found an LVC at the lower end of the range of changes in T2 lesion volume measured in untreated patients, consistent with the patient sample under study (clinical population of a predominantly tertiary referral clinic, not enrolled in any specific treatment trial). In contrast, the higher percentage of LVC detected by using SSEG suggests a much higher sensitivity to change with this method. This suggests that clinical trials using LVC as outcome might greatly benefit from this proposed new measure.
Studies of scan-rescan reproducibility of lesion segmentation have reported COV values ranging between 2.57% and 8.9%.19,31,32 CSEG's COV of 8.6% was toward the higher end, whereas the COV obtained with the addition of SSEG (0.98%) was well below the reported range. This improvement can be ascribed to the following reasons: the CSEG method requires one to first identify and then outline a larger number of lesions using the 2 nonregistered MR imaging datasets. By contrast, the SSEG method cancels out stable lesions so that only changing lesions (usually only a small subset of all lesions) must be identified and outlined. Second, to improve precision in lesion change assessment, the Yin-Yang artifact was defined and used to recognize partial volume and misregistration artifacts. Most of the time the misalignment of corresponding structures after registration is not homogeneous across the brain. For instance, rotational misregistration errors will be smaller closer to the rotation axis and larger further away from that axis. This geometric consideration is likely to translate into Yin-Yang artifacts being most visible in lesions where misregistration errors are larger (eg, farther from the rotation axis in this example). In the group of 31 patients with MS, 65 artifacts were encountered in the subtraction images. Of these, 50% of the artifacts were Yin-Yang artifacts, thereby limiting positive lesion change detection.
Because the primary objective in this validation study was a comparison with serial volumetry, lesions showing changes in intensity in the absence of volumetric change were excluded from analysis. In this study, 195 lesions with volumetric change were observed in 31 patients. In comparison, there were 25 lesions, which showed only change in intensity. It is interesting to note, however, that an additional element of qualitative change can be included that combines volumetric and intensity measurement, such as the weighted hyperintensity measure proposed previously.33 In that measure, each pixel is weighted by its relative hyperintensity or hypointensity, and the total sum then reflects both dimensions of tissue change.
The patients were selected without regard for clinical or radiologic findings, thereby limiting the assessment of SSEG in a specific clinical context. Nevertheless, analysis of relations to LVC with disease duration and BPF also demonstrated advantages of SSEG. In this small study of 21 patients, we observed moderate correlation (R = −0.45; P = .046) between lesion volume change computed with SSEG and change in BPF despite the absence of significant cross-sectional correlation between baseline lesion volume and baseline BPF or follow-up lesion volume and follow-up BPF. Rudick et al34 also observed a correlation (Spearman Rank R = −0.33; P < .01) between concurrent BPF change and T2 LVC over a 2-year follow-up of 140 patients. The confirmation of this correlation by using SSEG in such a small patient sample, together with the high scan-rescan reproducibility of this technique, further strengthens the argument that SSEG is a sensitive surrogate marker of MS lesion burden accrual.
It is known that less voluminous shifts in WM lesion volume occur in the secondary-progressive versus RR phases of MS.35 The relationship between disease duration and SSEG-derived LVC suggests that it could also be a potential predictor of an impending shift to the secondary-progressive phase of disease. The relationships between lesion volume change and atrophy or disease duration obtained in this study are intriguing but warrant further confirmation in a larger sample size. Applying SSEG to high-resolution images with isotropic voxel size and optimized lesion contrast may further improve the sensitivity of the proposed approach to measuring change in lesion burden.36–39
Conclusion
In summary, SSEG is a reproducible method that unveiled a relationship between T2 lesion change and concomitant brain atrophy and demonstrated a link between disease duration and net lesion volume change per year. SSEG is a promising tool providing detailed analysis of subtle alterations in lesion size and intensity and may provide critical outcome measures for clinical trials of novel treatments, as well as provide further insight into progression patterns of MS.
Footnotes
This work was supported in part by funding provided by the National Multiple Sclerosis Society grants (RG3574A1, RG3705A1, and RG3798A2), as well as the National Institutes of Health (R01 NS35142 and P41 RR13218-01). The MS Center Amsterdam was financially supported by the Dutch MS Research Foundation.
Previously presented in part at: Joint Annual Meeting International Society for Magnetic Resonance in Medicine, May 19–25, 2007; Berlin, Germany.
References
- Received April 4, 2007.
- Accepted after revision June 21, 2007.
- Copyright © American Society of Neuroradiology
In this issue


Jump to section
Related Articles
Cited By...
- PACS Integration of Semiautomated Imaging Software Improves Day-to-Day MS Disease Activity Detection
- Food allergies are associated with increased disease activity in multiple sclerosis
- Detection of Focal Longitudinal Changes in the Brain by Subtraction of MR Images
- Automatic Lesion Incidence Estimation and Detection in Multiple Sclerosis Using Multisequence Longitudinal MRI
- One year activity on subtraction MRI predicts subsequent 4 year activity and progression in multiple sclerosis