
Article Figures & Data
Figures
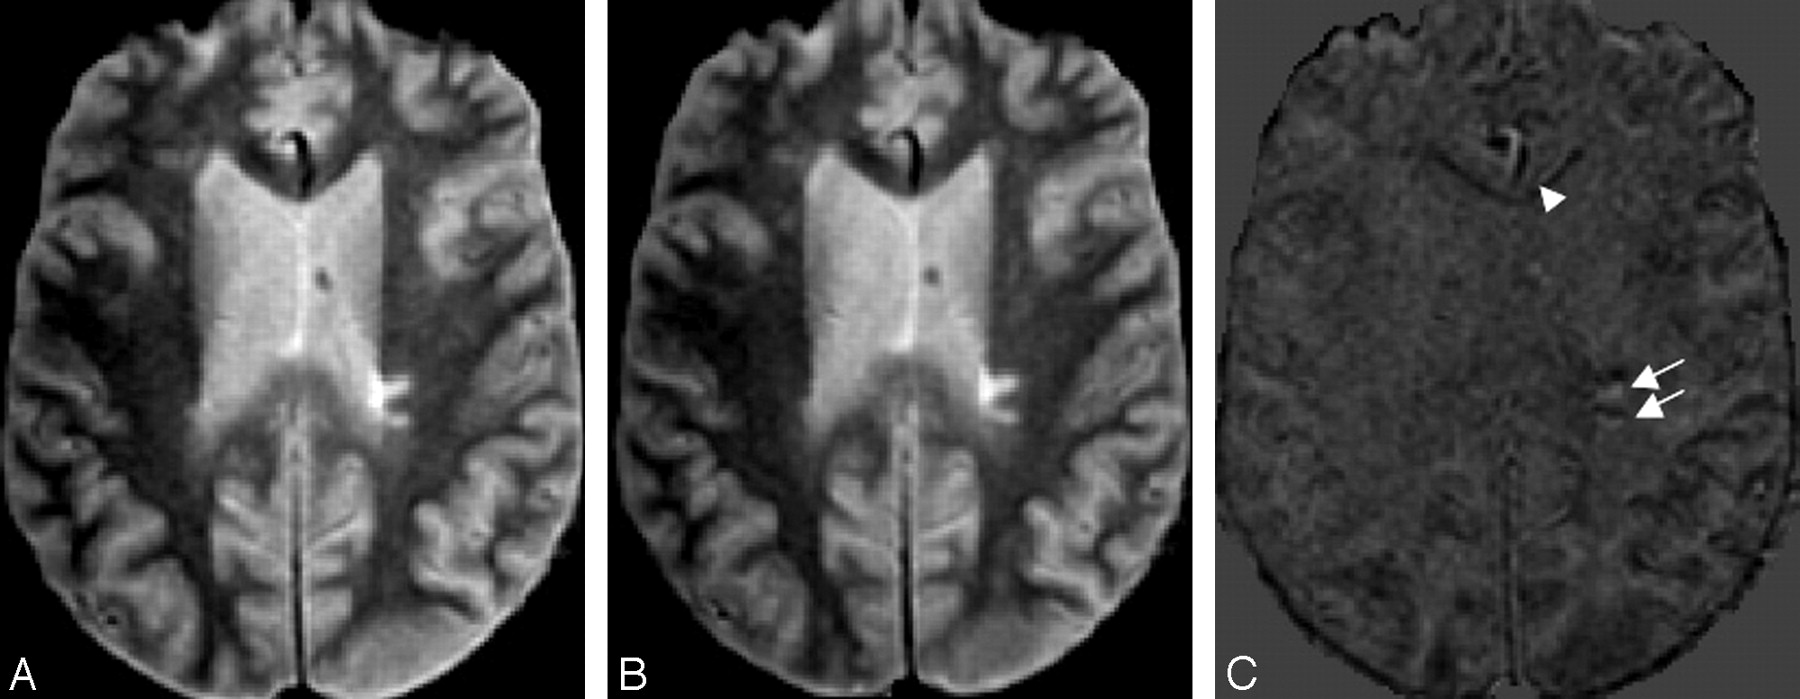
- Fig 1.
Subtraction of PD images from a 45-year-old male patient with MS scanned at an interval of 4.7 years shows resolving (white arrow and arrowhead), new (black arrowhead), and enlarging (black arrows) lesions. Left column, Baseline MR image. Middle column, Coregistered second time-point MR image. Right column, Subtraction image (time point 2 minus baseline). Subcortical resolving lesion and deep WM resolving lesion in the subtraction image are shown with a white arrowhead and white arrow, respectively. Subtle artifacts are seen on the boundary of the brain surface due to slight misregistration. (In all of the images, the skull has been stripped by masking with ICC.)
- Fig 2.
Yin-Yang artifact: scan-rescan MR images from the same day. Left column, Baseline image (scan). Middle column, Coregistered second time-point image (rescan). Right column, Subtraction image (rescan-scan). Yin-Yang artifacts are shown (white arrows) in the subtraction image (right column). An artifact from vessel misregistration is shown (white arrowhead) in the subtraction image. (In all of the images, the skull has been stripped by masking with ICC.)
- Fig 3.
Positive, negative, and net changes from pairs of subtraction images: the discriminatory power of SSEG. Change measurements obtained from pairs of dual-echo images using CSEG and SSEG methods are depicted. A, Patient-by-patient representation of lesion volume changes measured with SSEG and CSEG in pairs of dual-echo MR images from 21 patients with MS. The CSEG method can only measure the net change in lesion volume (black bar in each patient). In contrast, the SSEG method provides information about the volume change in new (red bars), enlarging (yellow bars), and resolving lesions (blue bars), as well as yielding a net lesion volume change (sum of new and enlarging lesion volumes minus resolving lesion volume; green bars). B, The average lesion volume changes measured with the CSEG and SSEG methods are shown. Greater average net lesion volume change is measured with the SSEG method, although no statistically significant difference is found in the net lesion volume change measured with both methods (P = 0.14, Wilcoxon test).
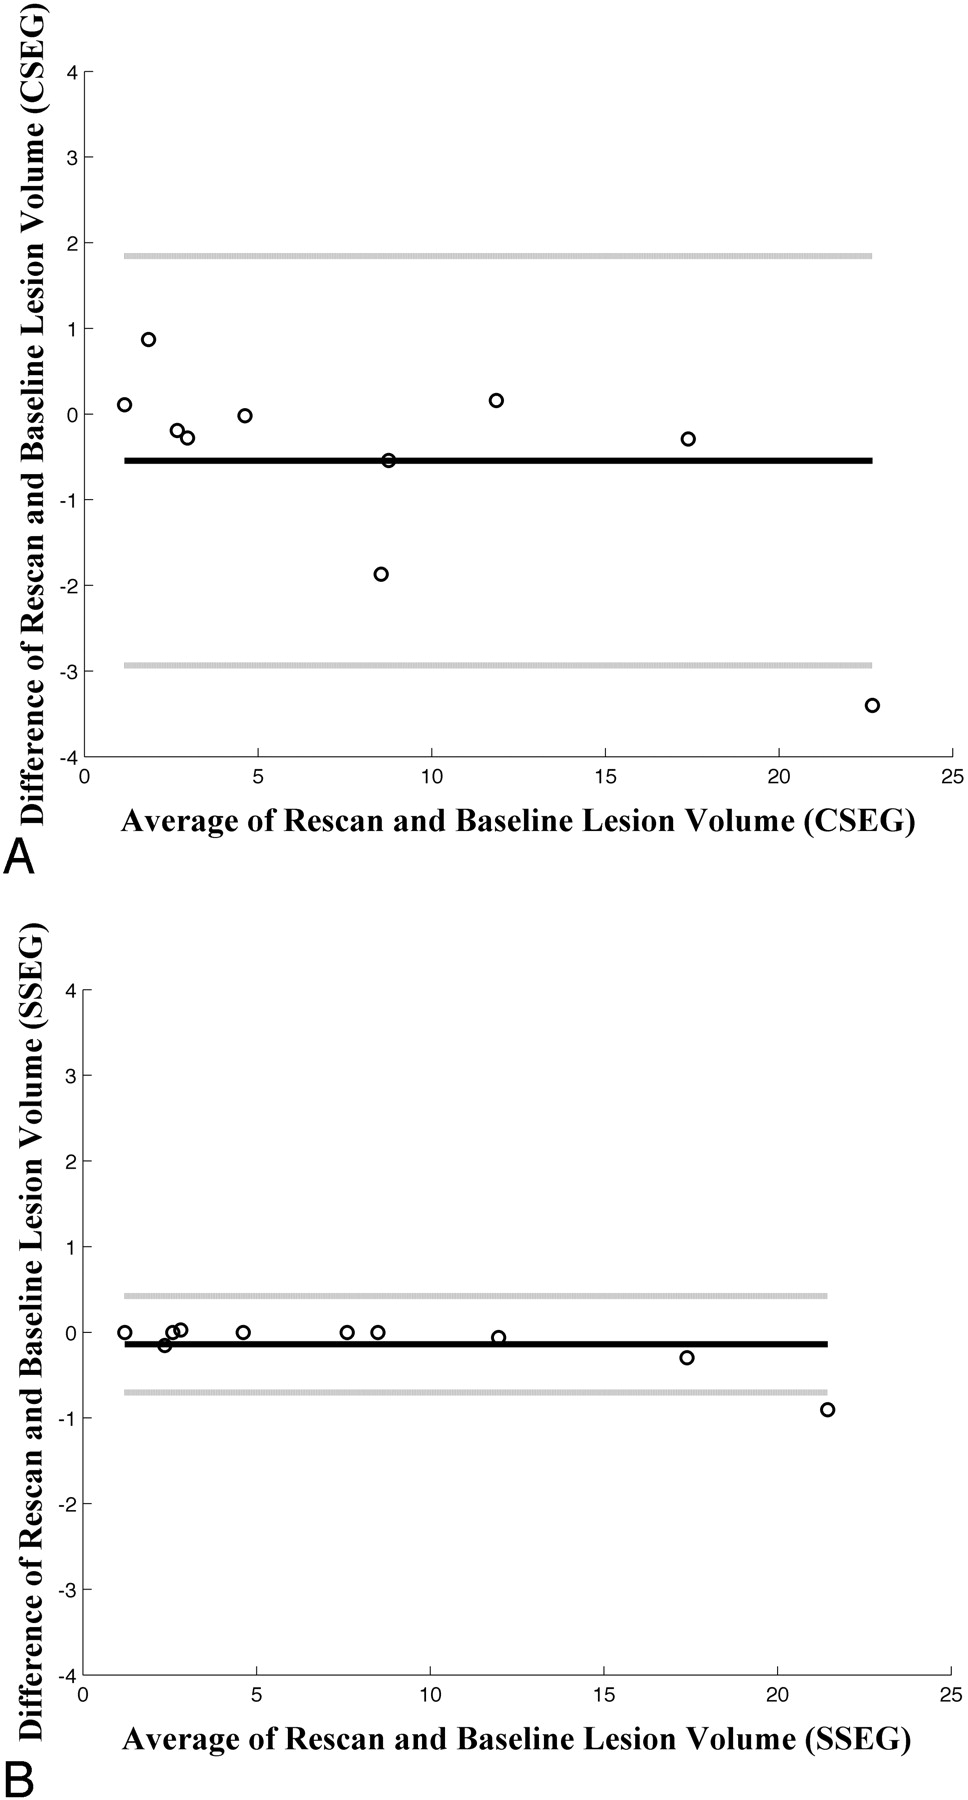
- Fig 4.
Reproducibility of SSEG and CSEG methods: Bland-Altman analysis in 10 patients (scan-rescan group). The solid line and the 2 dotted lines represent the mean ± 1.96 SD (95% confidence interval) of the difference of rescan lesion volume and baseline lesion volume, respectively. For both measurements, we use the same baseline lesion volume measured by CSEG. A, For the CSEG measurement, we used the baseline and rescan lesion volumes. B, For the SSEG measurement, the rescan lesion volume is the sum of baseline lesion volume (measured by CSEG) and the net change in lesion volume measured by the SSEG method. We see that the SSEG method has smaller confidence intervals, which indicate greater reproducibility.
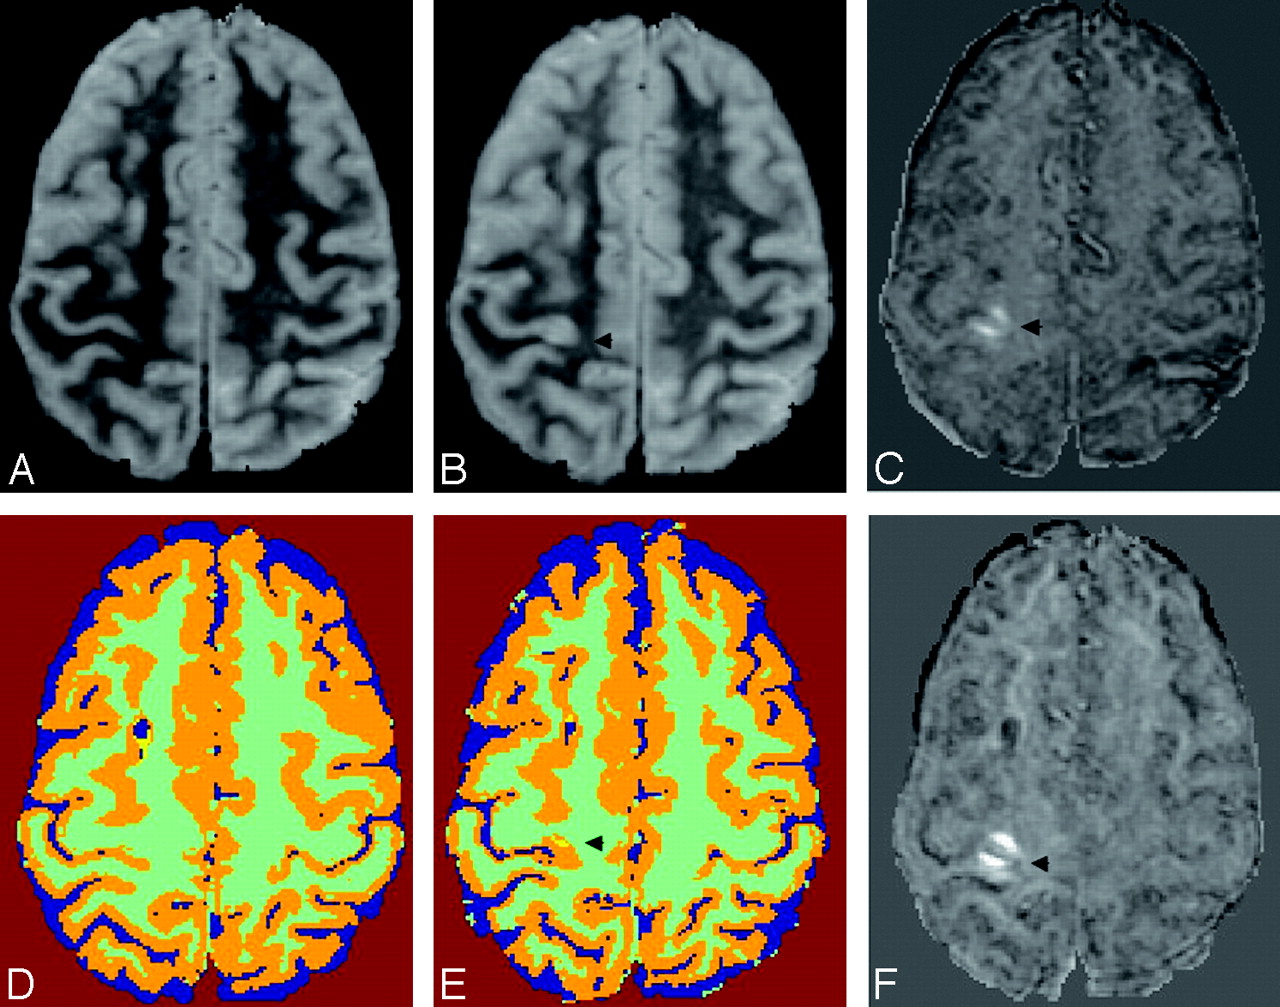
- Fig 5.
A juxtacortical lesion in a 44-year-old female patient with MS scanned at an interval of 3 years. A new juxtacortical lesion (arrow), difficult to appreciate on the native images and missed by CSEG, is clearly visible on the subtraction image (C) and SSEG (F). Baseline image (A) and its CSEG (D); Coregistered second time-point image (B) and its CSEG (E). The CSEG images were coregistered in this example to allow direct comparison. The CSEG method (D and E) segments CSF (blue), GM (orange), lesion (yellow), and WM (green); and SSEG method (F) only segments new lesion (pink). Subtle artifacts are seen on the boundary of the brain surface due to slight misregistration. (In all of the images, the skull has been stripped by masking with ICC.)
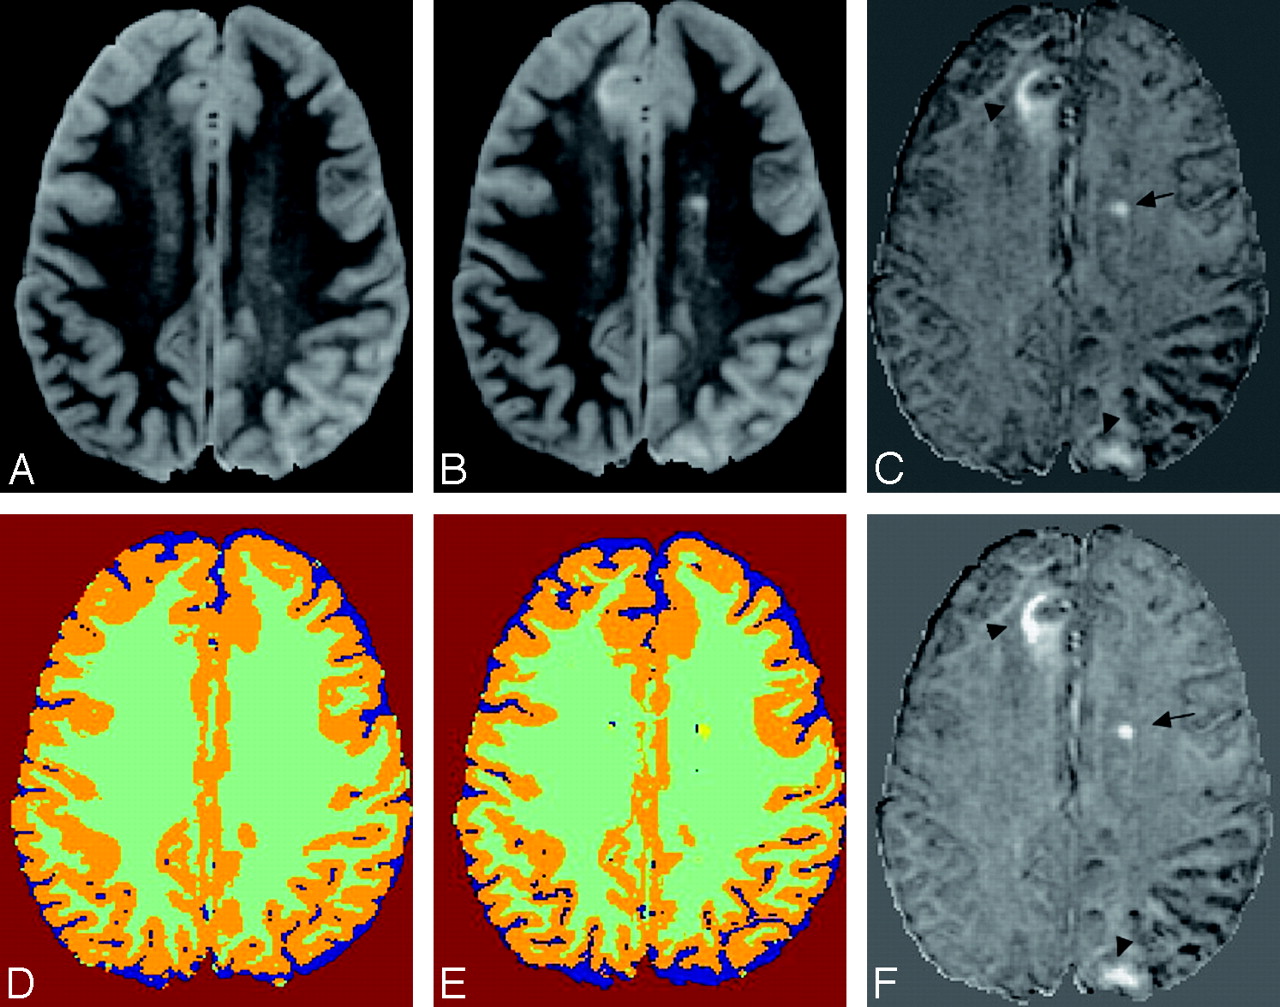
- Fig 6.
Two new cortical lesions and a new deep WM lesion in a 44-year-old female patient with MS scanned at an interval of 3 years. Baseline image (A) and its CSEG (D). Coregistered second time-point image (B) and the registered CSEG (E). Subtraction image (time point 2 minus baseline (C) and its SSEG (F). Two cortical lesions (arrowheads) are misclassified as normal GM with the CSEG method, but the subtraction image clearly shows these lesions. In addition, a new lesion is seen in the left preventricular deep WM (arrow). The CSEG method (D and E) segments CSF (blue), GM (orange), lesion (yellow), and WM (green); and SSEG method (F) only segments new lesions (pink). Subtle artifacts are seen on the boundary of the brain surface due to slight misregistration. (In all of the images, the skull has been stripped by masking with ICC.)


Tables
Methods Baseline Lesion Volume, Mean ± SD, cm3 Rescan Lesion Volume, Mean ± SD, cm3 Average Interscan COV, Mean ± SD, % Lesion Volume Change, Mean ± SD, cm3 Percentage of Lesion Volume Change, Mean ± SD, % CSEG 7.98 ± 6.8* 8.50 ± 7.66 8.64 ± 9.91 0.77 ± 1.1 11.40 ± 12.00 SSEG 7.98 ± 6.8* 8.12 ± 7.08† 0.98 ± 1.55 0.14 ± 0.28 1.50 ± 2.30 Note:—COV indicates coefficient of variation; CSEG, serial single time-point conventional segmentation; SSEG, segmentation of subtraction images.
* The same baseline lesion volume (calculated with CSEG) is used with the 2 methods.
† Rescan volume with SSEG = baseline volume (calculated with CSEG) + net lesion volume change (calculated with SSEG); percentage of lesion volume change = lesion volume change/baseline lesion volume.
- Table 2:
Correlation coefficients between clinical measurements and net lesion volume change and annual lesion volume change per year
Measurement Net Lesion Volume Change, cm3 Annual Lesion Volume Change, cm3/y SSEG, R, P CSEG, R, P SSEG, R, P CSEG, R, P Net BPF change −0.446, 0.046* −0.180, 0.421 N/A N/A Annual BPF change N/A N/A −0.430, 0.055† −0.232, 0.299 Interval time between MR imaging scans 0.234, 0.295 0.151, 0.499 N/A N/A Disease duration N/A N/A −0.508, 0.023* −0.360, 0.108 Note:—CSEG indicates serial single time-point conventional segmentation; SSEG, segmentation of subtraction images; BPF, brain parenchymal fraction; N/A, nonapplicability of a paired correlation. SSEG reveals relationships with net BPF change and disease duration, whereas CSEG does not.
* Significant results.
† Nearly significant results.
In this issue


Jump to section
Related Articles
Cited By...
- PACS Integration of Semiautomated Imaging Software Improves Day-to-Day MS Disease Activity Detection
- Food allergies are associated with increased disease activity in multiple sclerosis
- Detection of Focal Longitudinal Changes in the Brain by Subtraction of MR Images
- Automatic Lesion Incidence Estimation and Detection in Multiple Sclerosis Using Multisequence Longitudinal MRI
- One year activity on subtraction MRI predicts subsequent 4 year activity and progression in multiple sclerosis