
Abstract
BACKGROUND AND PURPOSE: High b-value diffusion-weighted imaging (DWI) provides different features not appreciated at lower b-value and have been recently studied in several clinical issues. The purpose of this study was to assess whether DWI at b = 3000 s/mm2 is more useful in discriminating high-grade and low-grade gliomas than DWI at b = 1000 s/mm2 at 3T.
MATERIALS AND METHODS: DWIs at both b = 1000 and 3000 s/mm2 were performed at 3T in 62 patients, 49 high-grade gliomas (20 World Health Organization [WHO] grade III and 29 grade IV) and 13 low-grade gliomas (13 grade II). Visual assessments based on 5-point scaled evaluations, receiver operating characteristic (ROC) curve analysis, and quantitative assessment based on DWI signal intensity (SI) ratio (tumor SI/normal SI) and apparent diffusion coefficient (ADC) values were compared between DWIs at b = 1000 and 3000 s/mm2.
RESULTS: By visual assessment, DWI at b = 3000 s/mm2 showed more conspicuous hyperintensity in high-grade gliomas and hypointensity in low-grade gliomas than DWI at b = 1000 s/mm2. Sensitivity and specificity at b = 3000 s/mm2 were higher than at b = 1000 s/mm2 (83.7%, 84.6% vs 69.4%, 76.9%, respectively). Quantitative assessments showed that mean SI ratio of high-grade gliomas was significantly higher than that of low-grade gliomas at both b-values. The mean ADC value of high-grade gliomas was significantly lower than that of low-grade gliomas at both b-values. The difference between the SI ratios of high-grade and low-grade gliomas was significantly larger at b = 3000 s/mm2 than at b = 1000 s/mm2.
CONCLUSION: DWI at b = 3000 s/mm2 is more useful than DWI at b = 1000 s/mm2 in terms of discriminating high-grade and low-grade gliomas at 3T.
Diffusion-weighted imaging (DWI) is a sensitive technique that reflects microscopic water diffusion with the use of a pair of strong diffusion gradients1 and has been used routinely for the early detection of cerebral ischemia with diffusion restriction.2 DWI and apparent diffusion coefficient (ADC) value have been studied in other clinical situations, including the differential diagnosis and grading of brain tumors.3–15
Although it is known that higher cellularity in high-grade glioma results in greater diffusion restriction and a reduction in ADC values, whereas lower cellularity in low-grade glioma increases ADC values,8–14 DWI at a standard b-value (b = 1000 s/mm2) at 1.5T barely differentiates high-grade and low-grade gliomas in many cases because of overlapping signal intensities (SI) on DWI and ADC maps.
Theoretically, a higher b-value DWI provides better contrast with its reflection of more tissue diffusivity and less T2 shinethrough effect.16, 17 However, at 1.5 or lower field strength, higher b-values are not usually used in clinical practice because of poor image quality secondary to an inferior signal-to-noise ratio (SNR).18–21 Recently, stronger gradients and faster slew rates have permitted high b-value DWI, particularly in 3T units, because higher SNRs at 3T compensate for the inferior SNRs of high b-value DWI without increasing data acquisition time.
The purpose of our investigation was to assess whether DWI at high b-value (b = 3000 s/mm2), is better than DWI at a standard b-value (b = 1000 s/mm2) for the differential diagnosis of high-grade and low-grade cerebral gliomas in clinical practice at 3T.
Methods
Patients
The institutional review board at our institution approved this retrospective study and waived the requirement for informed consent. A total of 62 patients with 49 high-grade (WHO grade III and IV) and 13 low-grade (WHO grade II) cerebral gliomas (42 men, 20 women; mean age, 46.8 years; age range, 6–77 years) diagnosed between March 2003 and May 2005 were included in the study (Table 1). All 62 gliomas were confirmed on pathologic examination.
Summary of histologic diagnoses and patient demographics
Imaging Data Acquisition
We performed all studies using a 3T MR system (Signa 3T; GE Medical Systems, Milwaukee, Wis) with a circularly polarized head coil. The system was equipped with high-performance gradients (40 mT/ms with slew rate of 150 mT/m/s). All patients underwent MR imaging with 2 DWIs at b = 1000 and 3000 s/mm2 in addition to unenhanced transverse and sagittal T1-weighted imaging, unenhanced transverse T2-weighted imaging, fluid-attenuated inversion-recovery (FLAIR) imaging, and contrast-enhanced T1-weighted imaging in 3 orthogonal planes.
We obtained both DWIs using a single-shot echo-planar spin-echo technique and the same following parameters: FOV, 24 × 24 cm; matrix size, 128 × 128; section thickness, 5 mm; section gap, 1.5 mm, and NEX,1. The TR and TE in DWI at b = 1000 and 3000 s/mm2 were 10,000/73.4 ms and 10,000/94.1 ms, respectively. Diffusion gradients were encoded in 3 orthogonal axes (x, y, and z) to generate trace DWI.
Qualitative Assessment
Two neuroradiologists (K.-H.C., D.G.N.), unaware of other conventional MR images and clinical/pathologic information, independently reviewed the DWI and scored the SIs of tumors on a 1- to 5-point scale. When a tumor had mixed SI, its most hyperintense SI was scored. After independent reviews were performed, discrepant cases were rescored by consensus between the 2 observers.
The 5-point scale assigned to tumor signals on DWI obtained at b = 1000 s/mm2 was as follows: 1 = markedly hypointense SI nearly equal to that of normal CSF; 2 = hypointense SI between those of normal CSF and normal subcortical white matter; 3 = isointense SI equal or similar to that of normal subcortical white matter; 4 = hyperintense SI between those of normal subcortical white matter and normal cortex; 5 = markedly hyperintense SI higher than that of normal cortex.
At b = 3000 s/mm2, points from 1 to 3 were assigned to tumor signals the same as those observed at b = 1000 s/mm2, but 4 points were assigned to hyperintense signals between those of the normal subcortical white matter and the corticospinal tract and 5 to markedly hyperintense signals that were equal to or higher than that of the normal corticospinal tract. The corticospinal tract was chosen as a reference tissue for hyperintensity because white matter, especially that in the corticospinal tract, was the most hyperintense normal brain structure on b = 3000 s/mm2 DWI.
Quantitative Assessment
Tumor DWI SI ratios and ADC values were obtained at b = 1000 s/mm2 and b = 3000 s/mm2 for all tumors. Circular regions of interest (ROIs) were placed in 3 different hyperintense portions of each tumor in an axial plane on each DWI by consensus between the 2 neuroradiologists (D.G.N., H.S.S.). The ROIs varied from 10 to 20 mm2 in area and were adjusted to include only regions of solid tumor based on the other nonenhanced and enhanced MR images. Areas of necrosis, cyst, hemorrhage, edema, and calcification were avoided.
Of these 3 ROIs, the ROI with the highest SI was selected for measurement purposes. We calculated the SI ratios by dividing the highest SI of a tumor by the SI of normal subcortical white matter in the contralateral cerebral hemisphere. We calculated the ADC values at b = 1000 s/mm2 using SIs at b = 0 and 1000 s/mm2, and ADC values at b = 3000 s/mm2 using SIs at b = 1000 and 3000 s/mm2.
Statistical Analyses
We performed statistical analyses using commercially available software packages (SPSS, version 12.0; SPSS, Chicago, Ill, and Medcalc, version 9.3; Medcalc Software, Mariakerke, Belgium). P values of less than .05 were considered statistically significant. In qualitative assessments, we compared mean 5-point scale scores for high-grade and low-grade gliomas using the Student t test. Receiver operating characteristic (ROC) curve analysis was performed to compare diagnostic performance at b = 1000 and 3000 s/mm2 with respect to differentiation of high-grade and low-grade gliomas. Areas under the ROC curve (Az values) were also calculated to summarize the performances of the 2 DWI types with respect to this differentiation. We calculated the sensitivities, specificities, and positive and negative predictive values at the 2 b-values by using cutoff scores corresponding to minimum C1 errors as determined by ROC analysis, where C1 = 1 − (sensitivity+specificity)/2. When the score of a tumor was higher than the cutoff score, we regarded the tumor as high grade. κ-coefficients of interobserver visual assessment agreements were calculated at both b-values.
In quantitative assessments, we compared the mean SI ratios and mean ADC values of high-grade and low-grade gliomas using the Student t test. Analysis of variance with a nondirectional Tukey post hoc procedure was used to compare those of the WHO grades of gliomas. The paired t test for matched pairs was used to compare those at b = 1000 and 3000 s/mm2.
Results
Qualitative Assessment
On DWI at b = 1000 s/mm2, all high-grade gliomas were, at least focally, markedly hyperintense (n = 34) or hyperintense (n = 15) (Fig 1), whereas low-grade tumors were markedly hyperintense (n = 3), hyperintense (n = 5), isointense (n = 3), or hypointense (n = 2) (Fig 2). At b = 3000 s/mm2, most high-grade tumors were markedly hyperintense (n = 36) or hyperintense (n = 5) (Fig 1), whereas most low-grade tumors were isointense (n = 5), hypointense (n = 4), or markedly hypointense (n = 2) (Fig 2). However, 2 grade II gliomas were markedly hyperintense.

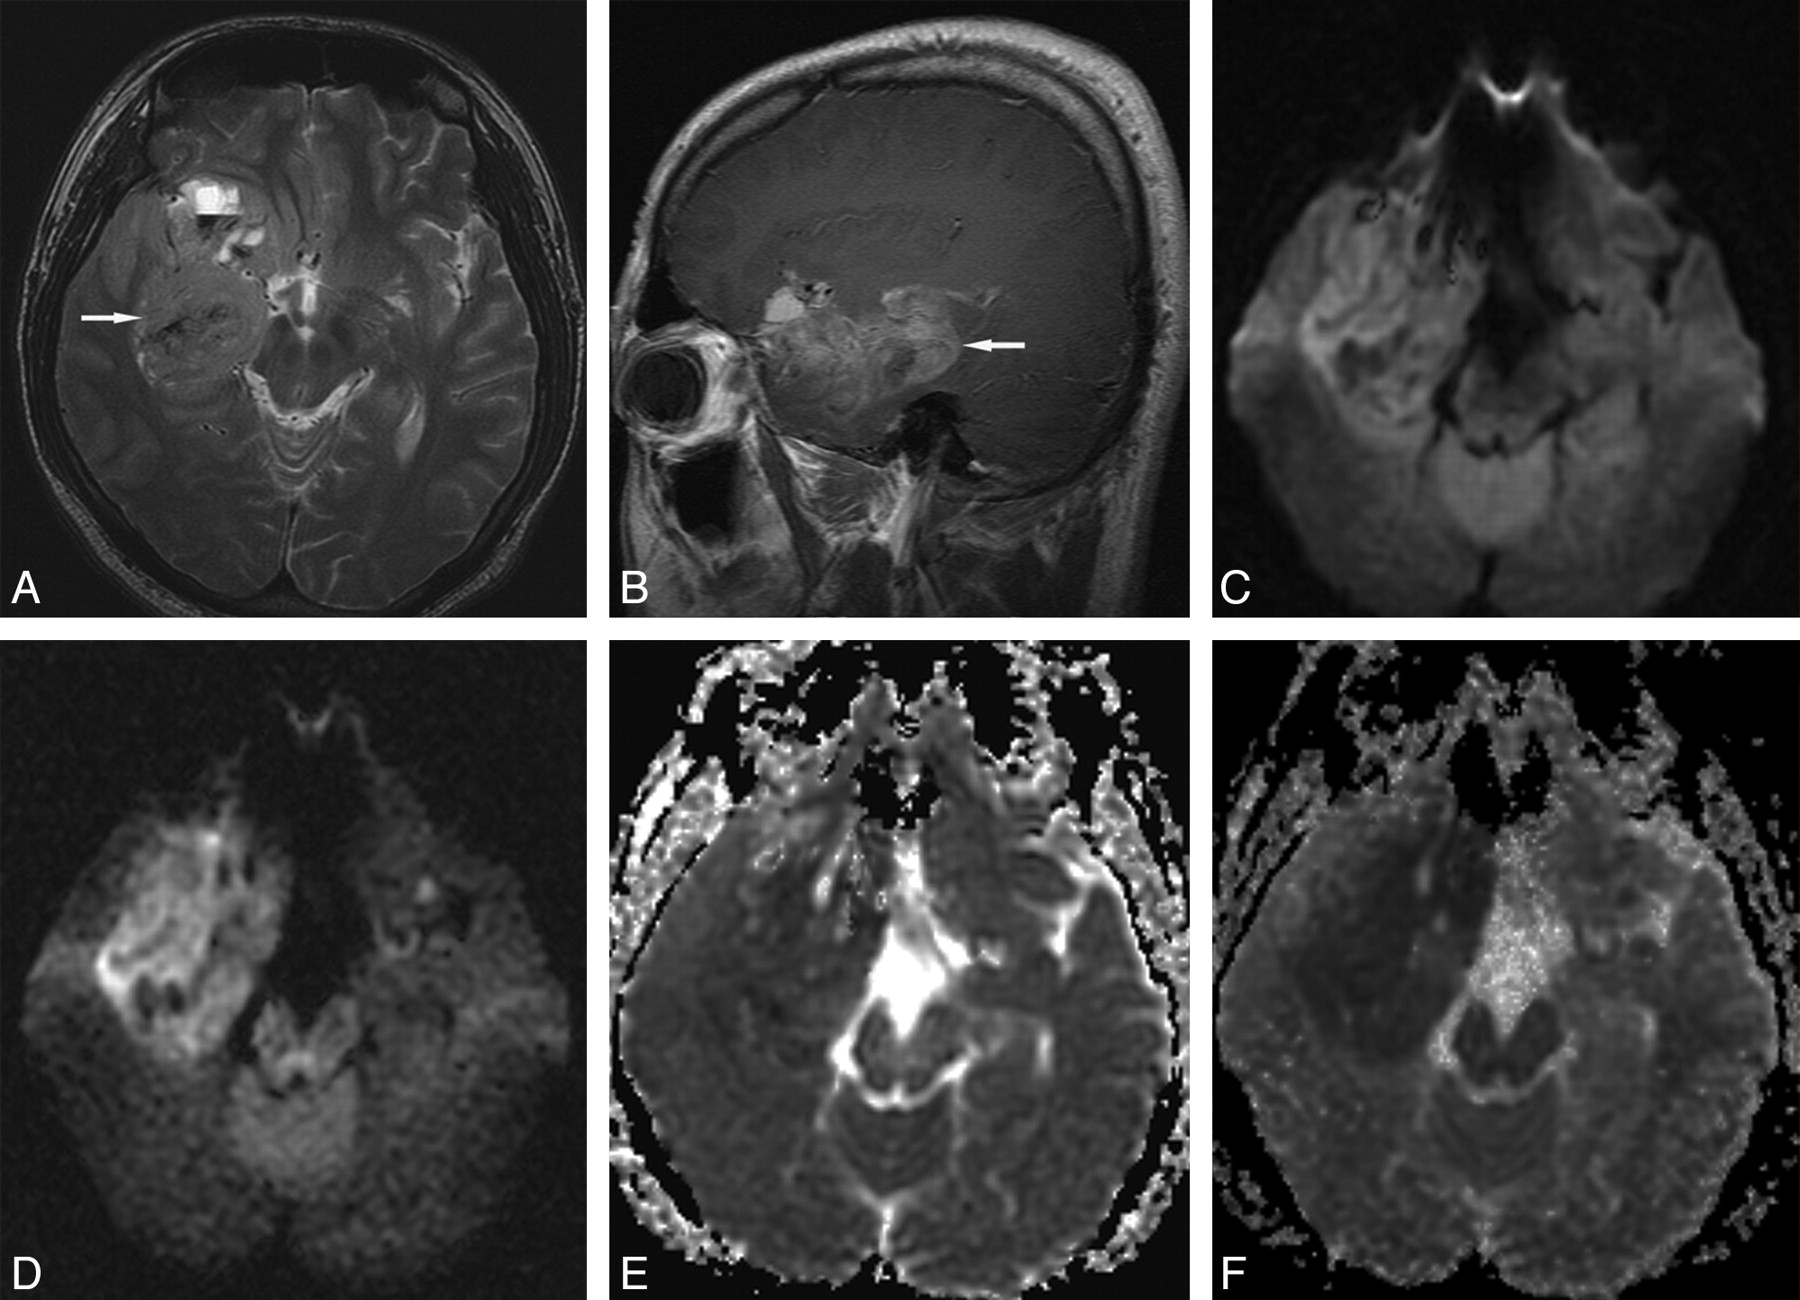
Grade IV glioblastoma in a 27-year-old man. A, Transverse T2-weighted image shows a slightly hyperintense main mass (arrow) in the right medial temporal lobe. B, Sagittal contrast-enhanced T1-weighted image shows diffuse tumor enhancement (arrow). C, Transverse DWI at b = 1000 s/mm2 shows slight tumor hyperintensity with some hypointense foci. D, Transverse DWI at b = 3000 s/mm2 shows more conspicuous main mass hyperintensity. E, Transverse ADC map at b = 1000 s/mm2 shows subtle or slight tumor hypointensity. F, Transverse ADC map at b = 3000 s/mm2 shows more conspicuous tumor hypointensity.

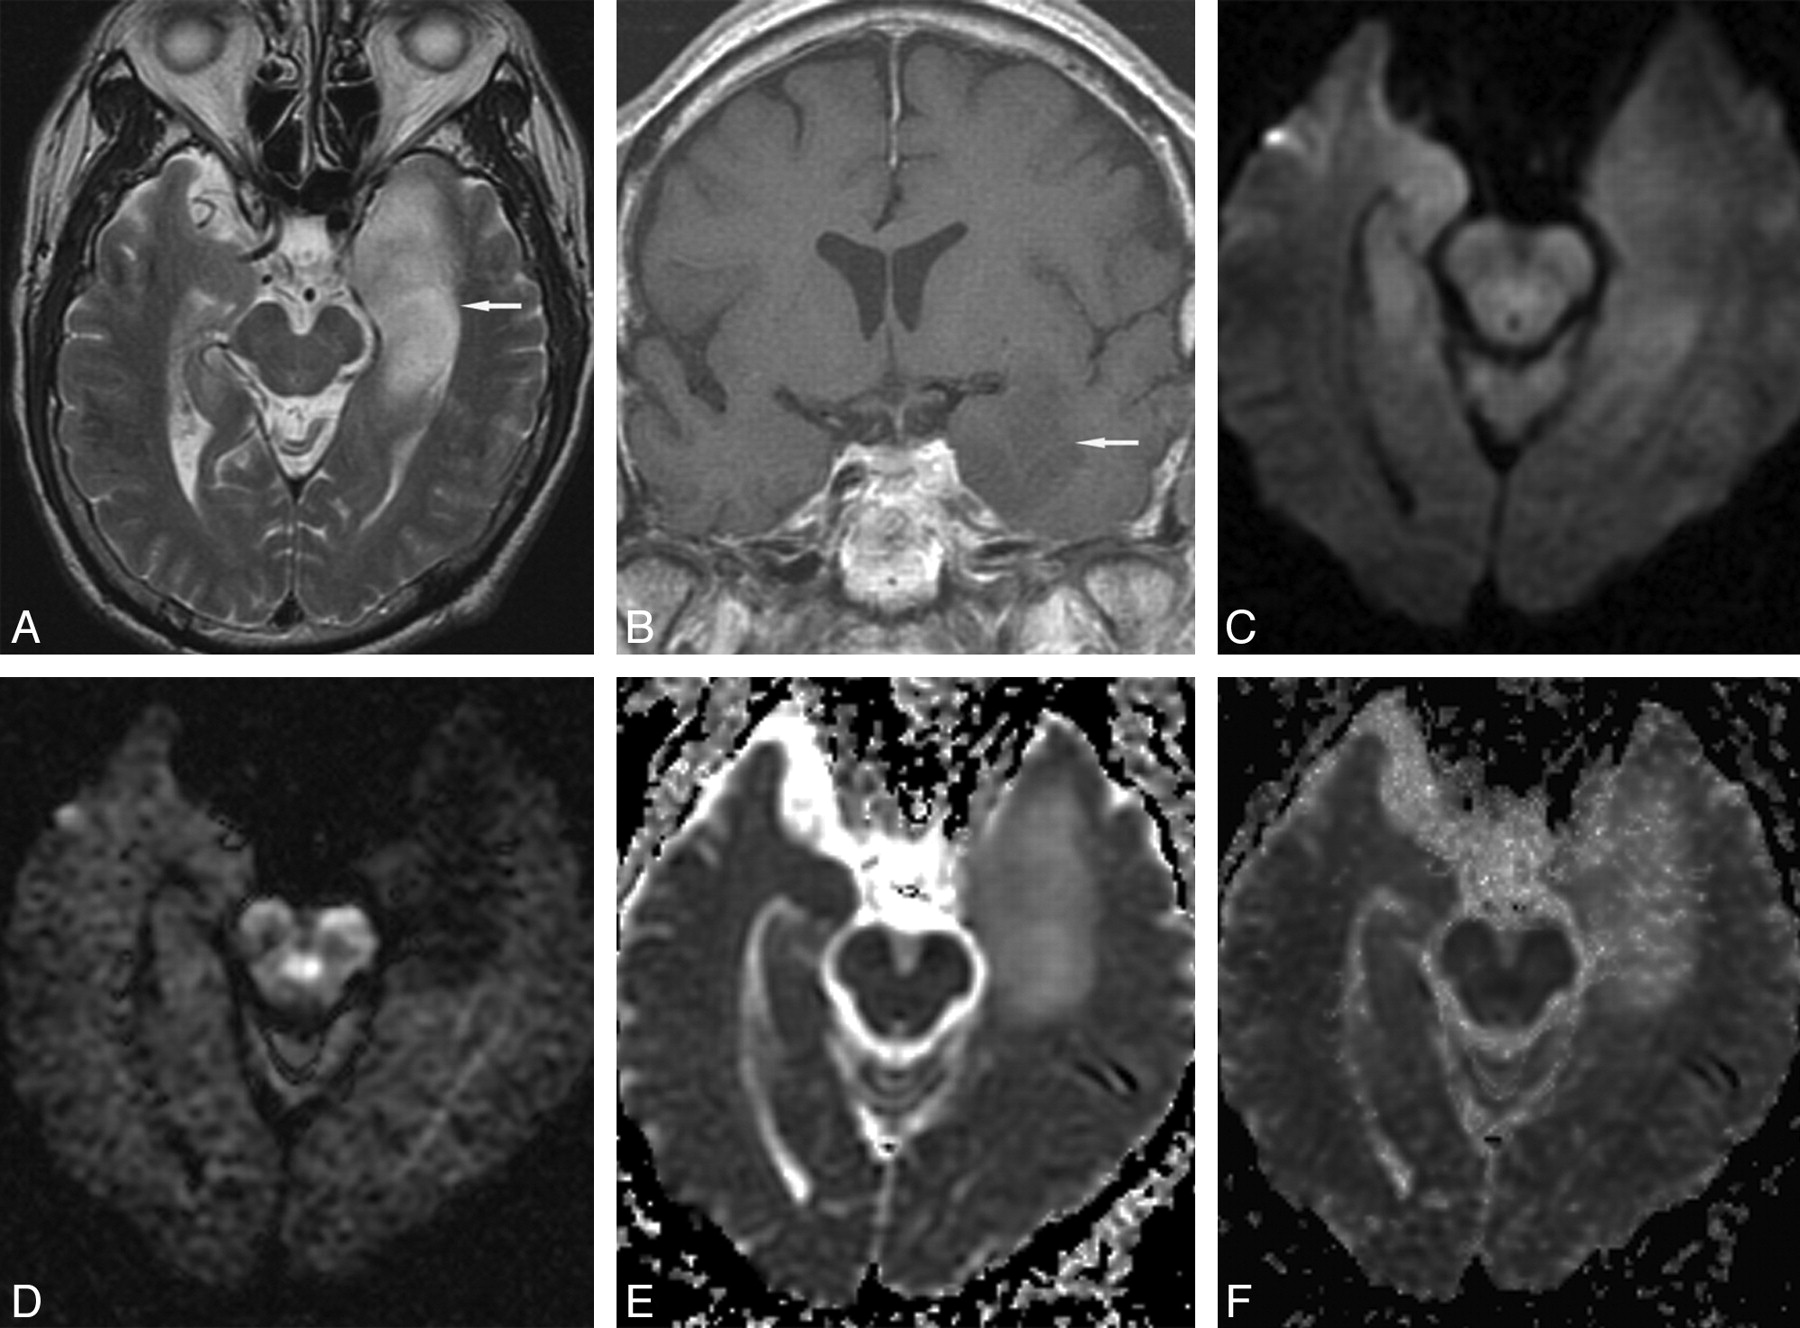
Grade II diffuse astrocytoma in a 66-year-old man. A, Transverse T2-weighted image shows a hyperintense mass (arrow) in the left medial temporal lobe. B, Coronal contrast-enhanced T1-weighted image shows slight tumor hypointensity without enhancement (arrow). C, Transverse DWI at b = 1000 s/mm2 shows tumor isointensity. D, Transverse DWI at b = 3000 s/mm2 shows marked tumor hypointensity. Transverse ADC maps at b = 1000 s/mm2 (E) and b = 3000 s/mm2 (F) show tumor hyperintensity.
Mean scores and ranges of DWI SIs of brain tumors according to the 5-point scale assessment are presented in Table 2. The mean score of all high-grade gliomas was significantly higher than that of low-grade gliomas at b = 1000 s/mm2 (4.7 ± 0.5 vs 3.7 ± 1.0; P < .05) and at b = 3000 s/mm2 (4.6 ± 0.8 vs 2.7 ± 1.3; P < .05), respectively. No significant SI difference was observed between WHO grade III and IV gliomas at either b-value (P > .05).
Mean scores and ranges of DWI signal intensities (SIs) in cerebral gliomas according to the five-point visual assessment scale used in this study
The ROC curves of DWIs at b = 1000 and 3000 s/mm2 are shown in Fig 3. The Az value of b = 3000 s/mm2 DWI was higher than that of b = 1000 s/mm2 DWI but the difference was not statistically significant (P =.08). As noted in Table 3, when the optimal cutoff scores for high-grade glioma were 5 at b = 1000 s/mm2 and 4 at b = 3000 s/mm2, sensitivity and specificity were higher for b = 3000 s/mm2 (83.7% and 84.6%, respectively) than for b = 1000 s/mm2 (69.4% and 76.9%, respectively). Positive and negative predictive values at b = 3000 s/mm2 were also higher than at b = 1000 s/mm2 (95.3% and 57.9% vs 94.4% and 40%, respectively). κ-values of interobserver agreement were higher at b = 3000 s/mm2 than at b = 1000 s/mm2.

ROC curves derived from 5-point scale visual assessment scores at b = 1000 and 3000 s/mm2. The Az value of DWI at b = 3000 s/mm2 was higher than at b = 1000 s/mm2 but this was not statistically significant (0.864 vs 0.790; P =.08).
Results of ROC analysis of DWIs at b = 1000 and b = 3000 s/mm2
Quantitative Assessment
In high-grade and low-grade gliomas, mean SI ratios and mean ADC values at b = 1000 and 3000 s/mm2 are presented in Tables 4 and 5. The mean SI ratio of high-grade gliomas was significantly higher than that of low-grade gliomas at both b-values (P < .05) (Fig 4A). The mean ADC value of high-grade gliomas was also significantly lower than that of low-grade gliomas at both b-values (P < .05) (Fig 4B). No significant difference was found between the SI ratios or ADC values of grade III and IV gliomas at either b-value.

Box plots of DWI SI ratios (A) in high-grade and low-grade gliomas, and ADC values (B) of high-grade and low-grade gliomas and normal subcortical white matter at b = 1000 and 3000 s/mm2. The horizontal line is the median, and the upper and lower ends of the boxes are the upper and lower quartiles, respectively. The vertical lines represent data ranges. A, The mean SI ratio of high-grade gliomas was significantly higher than that of low-grade gliomas at both b-values (P < .01). Note that the difference between the mean SI ratios of high-grade and low-grade gliomas at b = 3000 s/mm2 was significantly greater than at b = 1000 s/mm2 (P < .05). B, The mean ADC value of high-grade gliomas was significantly lower than that of low-grade gliomas at both b-values (P < .01). The mean ADC values of high-grade and low-grade gliomas and normal subcortical white matter at b = 3000 s/mm2 were significantly lower than at b = 1000 s/mm2, respectively (P < .01).
Comparison of mean DWI signal intensity (SI) ratios and standard deviations between b = 1000 s/mm2 and b = 3000 s/mm2 in high-grade and low-grade gliomas
Comparison of mean ADC values between b = 1000 s/mm2 (ADC1) and b = 3000 s/mm2 (ADC3) in high-grade and low-grade gliomas and normal subcortical white matter
The mean SI ratio of high-grade gliomas at b = 3000 s/mm2 was significantly higher than that at b = 1000 s/mm2 (P < .05), whereas the mean SI ratio of low-grade gliomas at b = 3000 s/mm2 was significantly lower than that at b = 1000 s/mm2 (P < .05) (Table 4). Thus, the difference between the mean SI ratios of high-grade and low-grade tumors at b = 3000 s/mm2 was greater than that at b = 1000 s/mm2.
The mean ADC values of brain tumors and normal subcortical white matter at b = 3000 s/mm2 were significantly lower than at b = 1000 s/mm2 (P < .01) (Table 5, Fig 4B). At a b-value of 3000 s/mm2, the ADCs of high-grade and low-grade gliomas decreased by 34% to 36%, whereas the ADC of normal subcortical white matter decreased by 20%.
Discussion
Cellularity is one of the most important determinations of brain tumor grade.22, 23 Increased cellularity in a high-grade tumor restricts the microscopic water movement in tissue,23, 24 and thus ADC values are lower than those of low-grade tumors, which have relatively low cellularity. As a result, high-grade tumors have more intense DWI SIs than low-grade tumors.8–14
In our study, our comparisons of DWIs at b = 1000 s/mm2 and b = 3000 s/mm2 showed more conspicuous hyperintensity in most high-grade gliomas, and more conspicuous hypointensity in most low-grade gliomas at b = 3000 s/mm2. This result indicates that differences between the SI ratios of high-grade and low-grade gliomas are larger at b = 3000 s/mm2 (Fig 4A), which results in better diagnostic performance (higher sensitivity and specificity) at b = 3000 s/mm2. In particular, this difference between b = 1000 s/mm2 and b = 3000 s/mm2 was more prominent in low-grade gliomas. Many hyperintense or isointense low-grade gliomas at b = 1000 s/mm2 became hypointense at b = 3000 s/mm2 with a mean SI ratio of less than 1. This greater difference in SI ratios at b = 3000 s/mm2 provides better contrast, which we attribute to a greater diffusion-weighted response and less T2 shinethrough effect at b = 3000 s/mm2.
As noted in Table 5, at b = 1000 s/mm2, the mean ADC values of high-grade and low-grade gliomas were higher than that of normal white matter, which concurs with previous studies,25, 26 but at b = 3000 s/mm2, the mean ADC values of high-grade gliomas were lower than that of normal white matter, whereas the ADC value of low-grade glioma remained higher than that of normal white matter (Fig 4B). Consequently, these changes in the ADC values in high-grade and low-grade gliomas at high b-value resulted in greater contrast between tumors and normal tissue.
As demonstrated in Table 3, a high positive predictive value (95.3%) indicates that DWI at b = 3000 s/mm2 is clinically useful to predict high-grade tumor (hyperintense or markedly hyperintense on DWI, or higher than score 4), though it is unlikely to replace biopsy to determine tumor grade and pathology. However, its low negative predictive value (57.9%) suggests that it is not as useful at predicting low-grade glioma when DWI SIs are isointense or hypointense, and that, thus, the technique should be applied with caution. If predictions of low-grade glioma were limited to hypointense or markedly hypointense masses, its positive predictive value for low-grade glioma would increase to approximately 85%.
ADC values decrease when b-values are increased beyond 1000 s/mm2.16, 27–31 DeLano et al16 reported that ADC values decreased by approximately 30% to 35% when b-values were increased from 1000 s/mm2 to 3000 s/mm2 for some ROIs. If the relationship between MR signals and b-values were monoexponential, the ADC values would remain constant for any 2-point calculation as b-values are increased. The observed ADC decrease on increasing b-values could be explained by biexponential SI decay. Fast and slow diffusion components have been described in human brain models, and at a relatively low b-value, SI is dominated by fast diffusion, whereas at a high b-value SI is governed predominantly by slow diffusion. Intracellular and extracellular water are considered to correspond to, but not exactly equal to, slow and fast diffusion components, respectively.27, 31–33
In the present study, degrees of ADC decrease at b = 3000 s/mm2 differed in tumors and normal brain tissue (34%–36% vs 20%, respectively). Although the reason for this difference is not known, we speculate that the slow diffusion component fraction, which may be determined by the concentrations of water-binding macromolecules, cellular size, and changes in tissue architecture,30 is larger in brain tumors than in normal brain tissue.
The trade-off of using a high b-value is SNR reduction.20, 21 In our study at 3T, mean SNR at b = 3000 s/mm2 and with NEX of 1 was approximately one third of mean SNR at b = 1000 s/mm2 and with NEX of 1 (30.8 ± 21.7 vs 93.5 ± 42.1). However, the lower SNR at b = 3000 s/mm2 and NEX of 1 did not lead to any diagnostic problem in our study. Thus, higher SNRs at 3T seem to overcome the SNR decrease associated with the use of a high b-value.
One of the limitations of our study concerns the identifications of areas containing highest SIs in tumors with variable tissue components. In our study, we adopted the method described by Wetzel et al,34 who selected highest SI regions from among 3 measurements to determine high-grade tumors in their perfusion MR imaging study. Different TEs at b = 1000 s/mm2 and b = 3000 s/mm2 could have been another limitation. The TEs used in our study were minimum TEs and were optimized for the 2 b-values.
Conclusion
DWI at b = 3000 s/mm2 showed more conspicuous hyperintensity than DWI at b = 1000 s/mm2, at least focally, in most high-grade gliomas, and hypointensity in most low-grade gliomas. Sensitivity and specificity at b = 3000 s/mm2 were higher than those at b = 1000 s/mm2 (83.7% and 84.6% vs 69.4% and 76.9%, respectively), and the quantitative assessment showed that differences between the SI ratios of high-grade and low-grade gliomas were significantly larger at b = 3000 s/mm2 than at b = 1000 s/mm2. Thus, we recommend that high b-value DWI (b = 3000 s/mm2) be used to predict the grade of cerebral gliomas at 3T.
References
- Received May 22, 2007.
- Accepted after revision August 13, 2007.
- Copyright © American Society of Neuroradiology
In this issue


Jump to section
Related Articles
Cited By...
- Differentiation of Recurrent Tumor and Posttreatment Changes in Head and Neck Squamous Cell Carcinoma: Application of High b-Value Diffusion-Weighted Imaging
- Apparent Diffusion Coefficient with Higher b-Value Correlates Better with Viable Cell Count Quantified from the Cavity of Brain Abscess
- High-b-Value Diffusion MR Imaging and Basal Nuclei Apparent Diffusion Coefficient Measurements in Variant and Sporadic Creutzfeldt-Jakob Disease