
Abstract
BACKGROUND AND PURPOSE: MR angiography (MRA) is increasingly used as an alternative to digital subtraction angiography (DSA) to evaluate internal carotid artery (ICA) stenosis. Because MRA is not standardized in data acquisition and postprocessing, we sought to evaluate the effects of different acquisition techniques (time-of-flight MRA [TOF-MRA]) and contrast-enhanced MRA [CE-MRA]) and postprocessing methods (maximum intensity projection [MIP], multiplanar reformation [MPR], and volume-rendering on stenosis grading.
MATERIALS AND METHODS: Fifty patients (33 men, 17 women) with symptomatic ICA stenosis were examined at 1.5T. Two imaging techniques and 3 postprocessing methods resulted in 6 image datasets per patient. Two readers independently evaluated ICA stenosis according to the North American Symptomatic Carotid Endarterectomy Trial criteria. Interobserver variability was calculated with the Pearson correlation coefficient and simultaneous confidence intervals (CI). The relationship of the values of ICA stenosis between the techniques was assessed by means of simultaneous 95% Tukey CI.
RESULTS: Interobserver agreement was high. Higher concordance was found for postprocessing techniques with TOF- than with CE-MRA; the mean difference between TOF-MPR and TOF-MIP was 0.4% (95% CI, −2.9%–3.8%). Stenosis values for CE-MPR differed significantly from those of CE volume-rendering (7.2%; 95% CI, 3.9%–10.6%).
CONCLUSION: Stenosis grading was found to be independent of the postprocessing technique except for comparison of CE-MPR with CE volume-rendering, with the volume-rendering technique resulting in higher stenosis values. MPR seems to be best-suited for measurement of ICA stenosis. Parameter setting is critical with volume-rendering, in which stenosis values were consistently higher compared with the other methods.
In large clinical trials like the North American Symptomatic Carotid Endarterectomy Trial, the European Carotid Surgery Trial, or the Asymptomatic Carotid Atherosclerosis Study, therapeutic decisions were based on the degree of internal carotid artery (ICA) stenosis determined with digital subtraction angiography (DSA).1–4 DSA is still regarded as the gold standard because it provides the highest spatial resolution and dynamic information. On the other hand, the procedure is expensive5,6 and associated with neurologic complications.7–9
MR angiography (MRA) offers multiple projections, 3D depiction of vessels, and cross-sectional images for the exact measurement of the stenotic lumen and might replace intra-arterial carotid angiography for the measurement of ICA stenosis.10
MRA is increasingly used as a confirmatory examination in patients presenting with either symptomatic or asymptomatic atherosclerotic disease of the ICA after undergoing Doppler sonography. Frequently patients scheduled for intervention (surgery or stent placement) present with MRA examinations performed at other institutions or imaging centers, bringing along either CD-ROMs including source images as well as maximum intensity projection (MIP), multiplanar reformation (MPR), or volume-rendering studies or only hard copies (film or paper) with postprocessed MRA studies. Contrast enhanced MRA (CE-MRA) is the predominant technique due to larger volume coverage and shorter examination time. On the other hand, non-CE techniques like 3D time-of-flight MRA (3D-TOF-MRA) are having a renaissance because of an increasing number of reports about the adverse effects of gadolinium, especially nephrogenic systemic fibrosis in patients with renal impairment.11
The aim of our study was to compare different imaging techniques (CE-MRA, TOF-MRA) and postprocessing methods (MPR, MIP, volume-rendering) to detect significant differences in stenosis measurement between the imaging techniques or postprocessing methods.
Materials and Methods
Patients
Fifty patients with symptoms related to atherosclerotic disease of the ICA (transient ischemic attack, amaurosis fugax, or stroke) were prospectively included in this study. The symptoms were assessed by analysis of patients’ records. Informed consent was obtained from each patient. The study was performed under an institutional review board–approved protocol. Patients’ mean age was 67.5 ± 10.8 years (range, 37–85 years): 17 were women (mean age, 66.2 ± 12.2 years; range, 37–80 years) and 33 were men (mean age, 68.2 ± 10.1 years; range, 40–85 years).
Imaging Protocol
Examinations were performed on a 1.5T MR imaging system (Symphony equipped with a Quantum Gradient System; Siemens Medical Solutions, Erlangen, Germany) by using a head and neck coil array. Sagittal 2D phase-contrast images were obtained as a vessel scout to plan the 3D-TOF-MRA and 3D-CE-MRA sequences. Details of the imaging parameters are given in Table 1.
Imaging parameters for 3D-TOF and 3D-CE-MRA
After acquisition of 3D-TOF-MRA, CE-MRA was performed by acquiring a precontrast scan (mask scan), followed by arterial phase imaging with individually adapted start delays determined by a test-bolus method. Twenty milliliters of contrast agent (gadopentetate dimeglumine, Magnevist; Schering, Berlin, Germany) was injected with a power injector at a rate of 2 mL/s followed by 20 mL of saline. To suppress anatomic background and to enhance vascular visualization, we subtracted mask images from the CE images.
Image Postprocessing and Analysis:
All datasets were sent to a 3D workstation (Leonardo VD10B, Siemens). Patient identification tags were removed. Data were evaluated by using MPR, MIP, and 3D volume-rendering. Two image-acquisition techniques (TOF-MRA, CE-MRA) and 3 postprocessing methods (MPR, MIP, volume-rendering) resulted in 6 different techniques for each carotid artery. A resident and a senior radiologist evaluated the patients. Readers were blinded to clinical data and each other's results. The different techniques were evaluated in random order with an interval of at least 2 weeks between the sessions to reduce bias introduced by recall of cases.
Measurements on MPRs were performed on image planes oriented perpendicular to the vessel. MIP images were generated for each carotid artery separately, and overlaying structures (ie, vertebral arteries, external carotid artery) were eliminated if necessary for stenosis measurement. Volume-rendering models were created by using predefined settings (opacity 100% for TOF and 90% for CE images) to optimize delineation of the vessel lumen. Parameter settings were predefined by direct comparison of MRA and DSA in a subset of 5 patients who were not included in the study. To compensate for differences in signal intensity between individual examinations, observers were allowed to perform minor adjustments to optimize vessel visualization. Volume-rendering and MIP datasets could be rotated freely to improve depiction of the maximal lumen narrowing.
Measurements were taken at the site of maximal lumen narrowing and the distal reference well beyond the carotid bulb, where the vessel walls were parallel again,12 by using an electronic ruler with a resolution of 0.1 mm. The degree of the stenosis was calculated by using the following equation: stenosis = (1 − minimal residual lumen/distal ICA diameter) × 100%.
Because we did not categorize stenosis, we had to assign discrete stenosis values when no measurements could be taken: 100% for total occlusion, 95% for near occlusion, and 90% in cases of local signal-intensity loss not fulfilling the criteria of near occlusion.12,13 “Near occlusion” was defined as high-grade stenosis with a significant lumen reduction of the poststenotic arterial lumen compared with the contralateral artery.14,15
Statistical Analysis
Only the symptomatic side was used for statistical analysis. For each of the 6 techniques (TOF-MPR, TOF-MIP, TOF volume-rendering, CE-MPR, CE-MIP, CE volume-rendering), interobserver agreement was determined by means of scatterplots with the Pearson correlation coefficient and calculation of simultaneous 95% confidence intervals (CIs). The null hypothesis postulated the equivalence of the 6 techniques. Deflections from the null hypothesis were assessed by means of simultaneous 95% Tukey CI for the mean difference in stenosis in a 1-way layout for the aligned stenosis values. A P value of less than .05 was regarded as statistically significant.
The relationship of the stenosis values between techniques or readers is demonstrated by scatter- and Bland-Altman plots with slightly jittered values.16,17 In these plots, the x-coordinate represents the mean value for each individual patient between observers, techniques, or postprocessing methods, and the y-coordinate represents the difference in the percentage of stenosis for the individual measurement. Alignment of stenosis values by centering them for each patient around their mean allows comparison of stenosis differences between patients at a common measurement scale.18
The data for comparison between techniques or postprocessing methods were averaged between the observers for each individual patient. All computations were performed in R19; simultaneous 95% CIs were computed by using the “multicomp” add-on package.20
Results
CE- and TOF-MRA provided good image quality without significant venous enhancement. The average degree of stenosis in our patient population was as follows: 57.2% (TOF-MPR), 57.7% (TOF-MIP), 59.8% (TOF volume-rendering), 55.4% (CE-MPR), 58.3% (CE-MIP), and 62.6% (CE volume-rendering). Correlations between the observers were high, with correlation coefficients ranging from 0.97 (CE-MIP) to 0.99 (TOF-MPR). No statistically significant differences between the ICA stenosis values for both readers were found (Fig 1).

Comparison of differences in stenosis values between the observers. All lines indicating the 95% CI cross the zero line. This shows that observers do not differ significantly in the measurement of ICA stenosis. obs indicates observer; VR, volume-rendering.
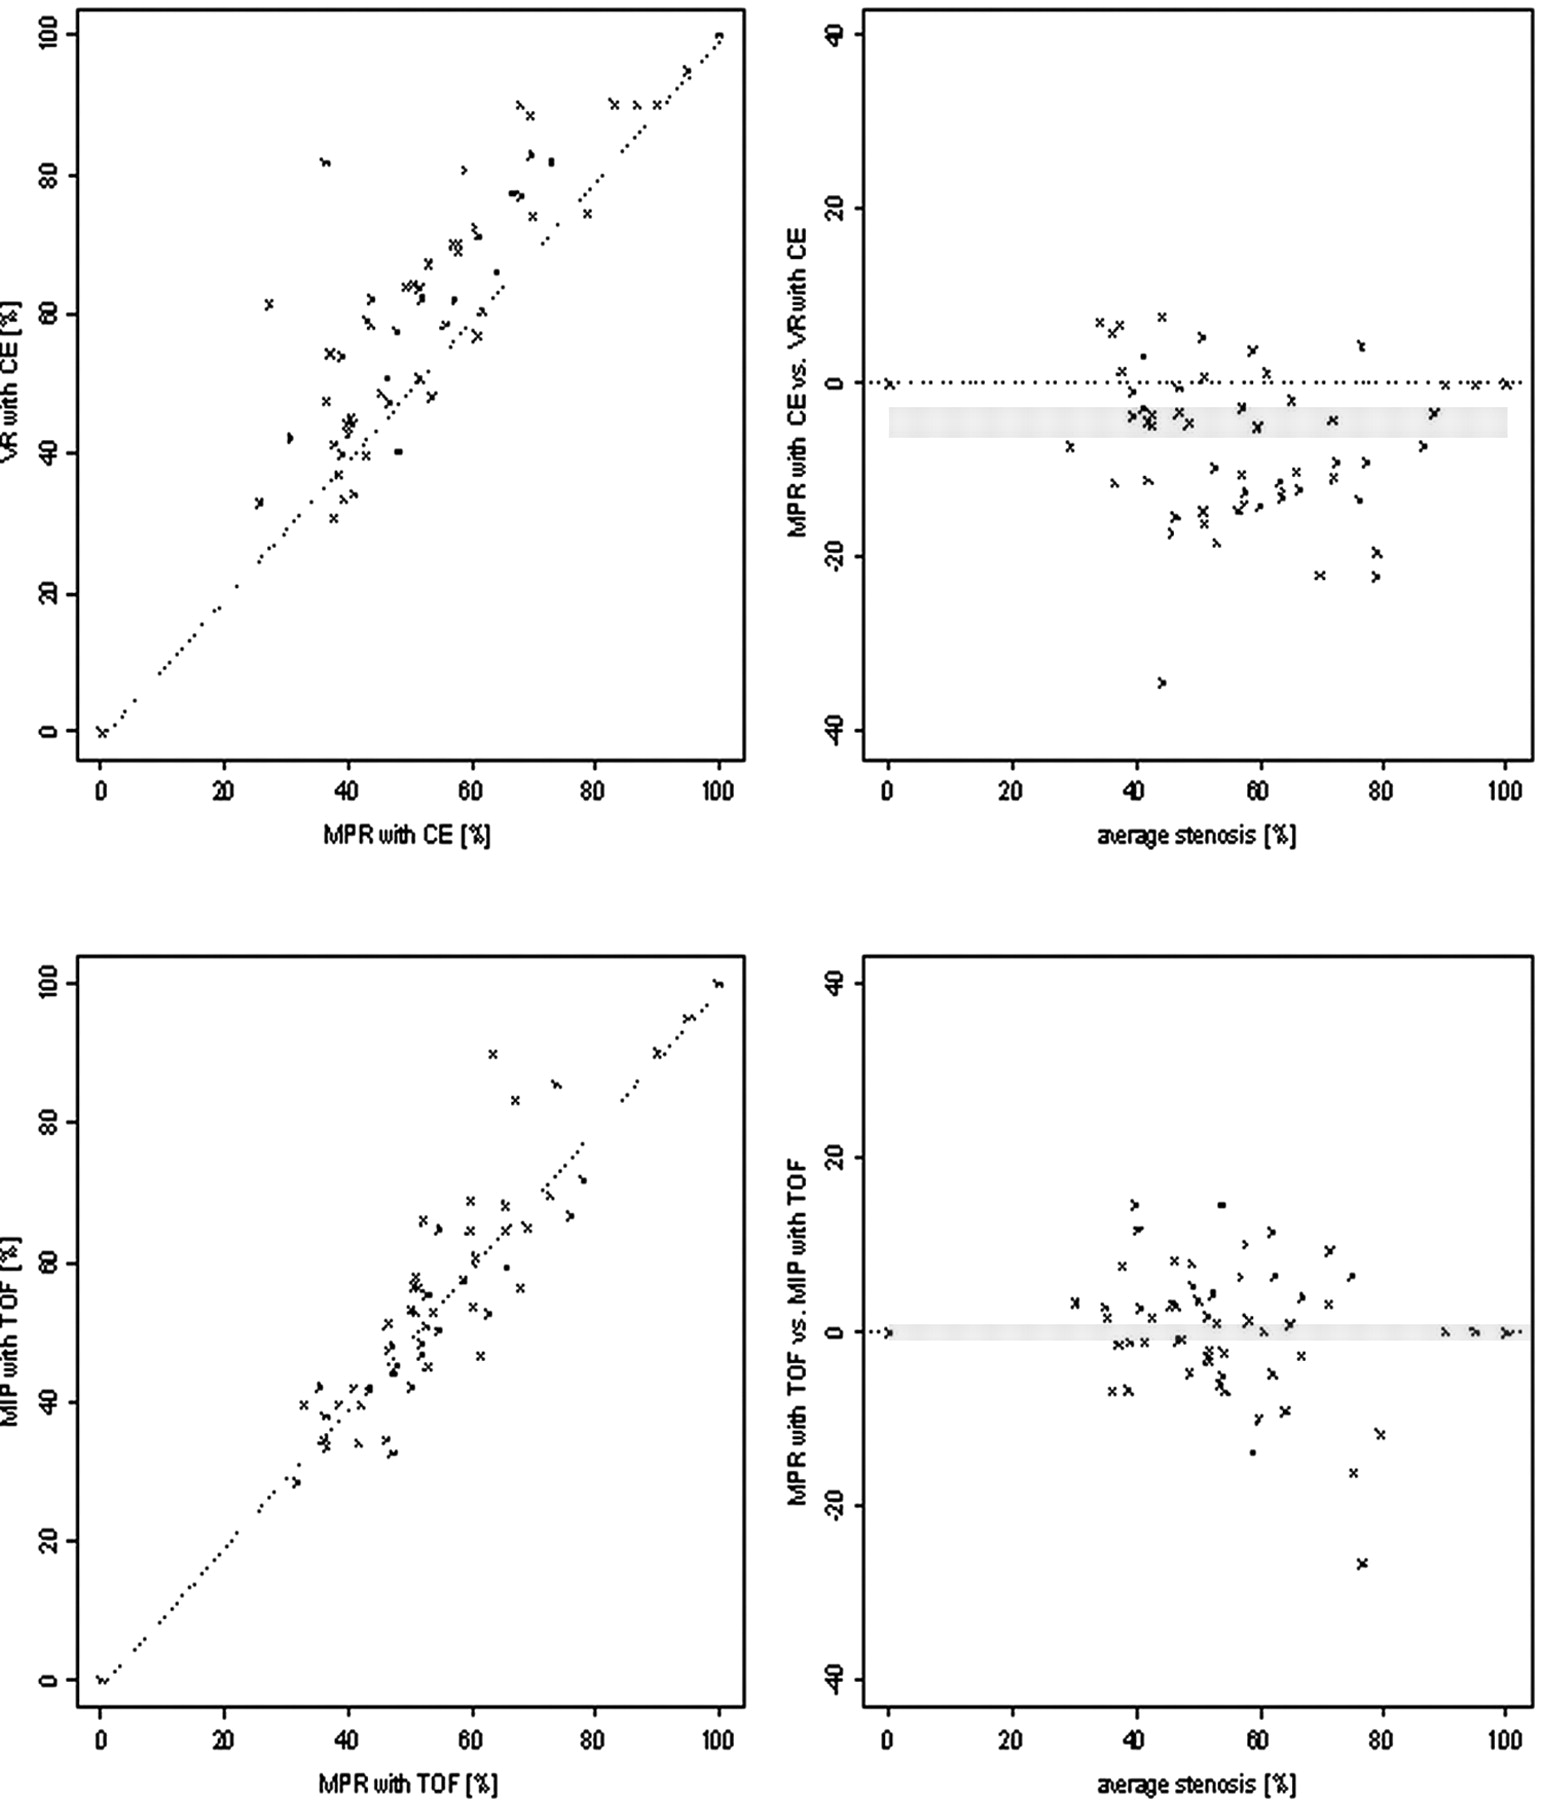
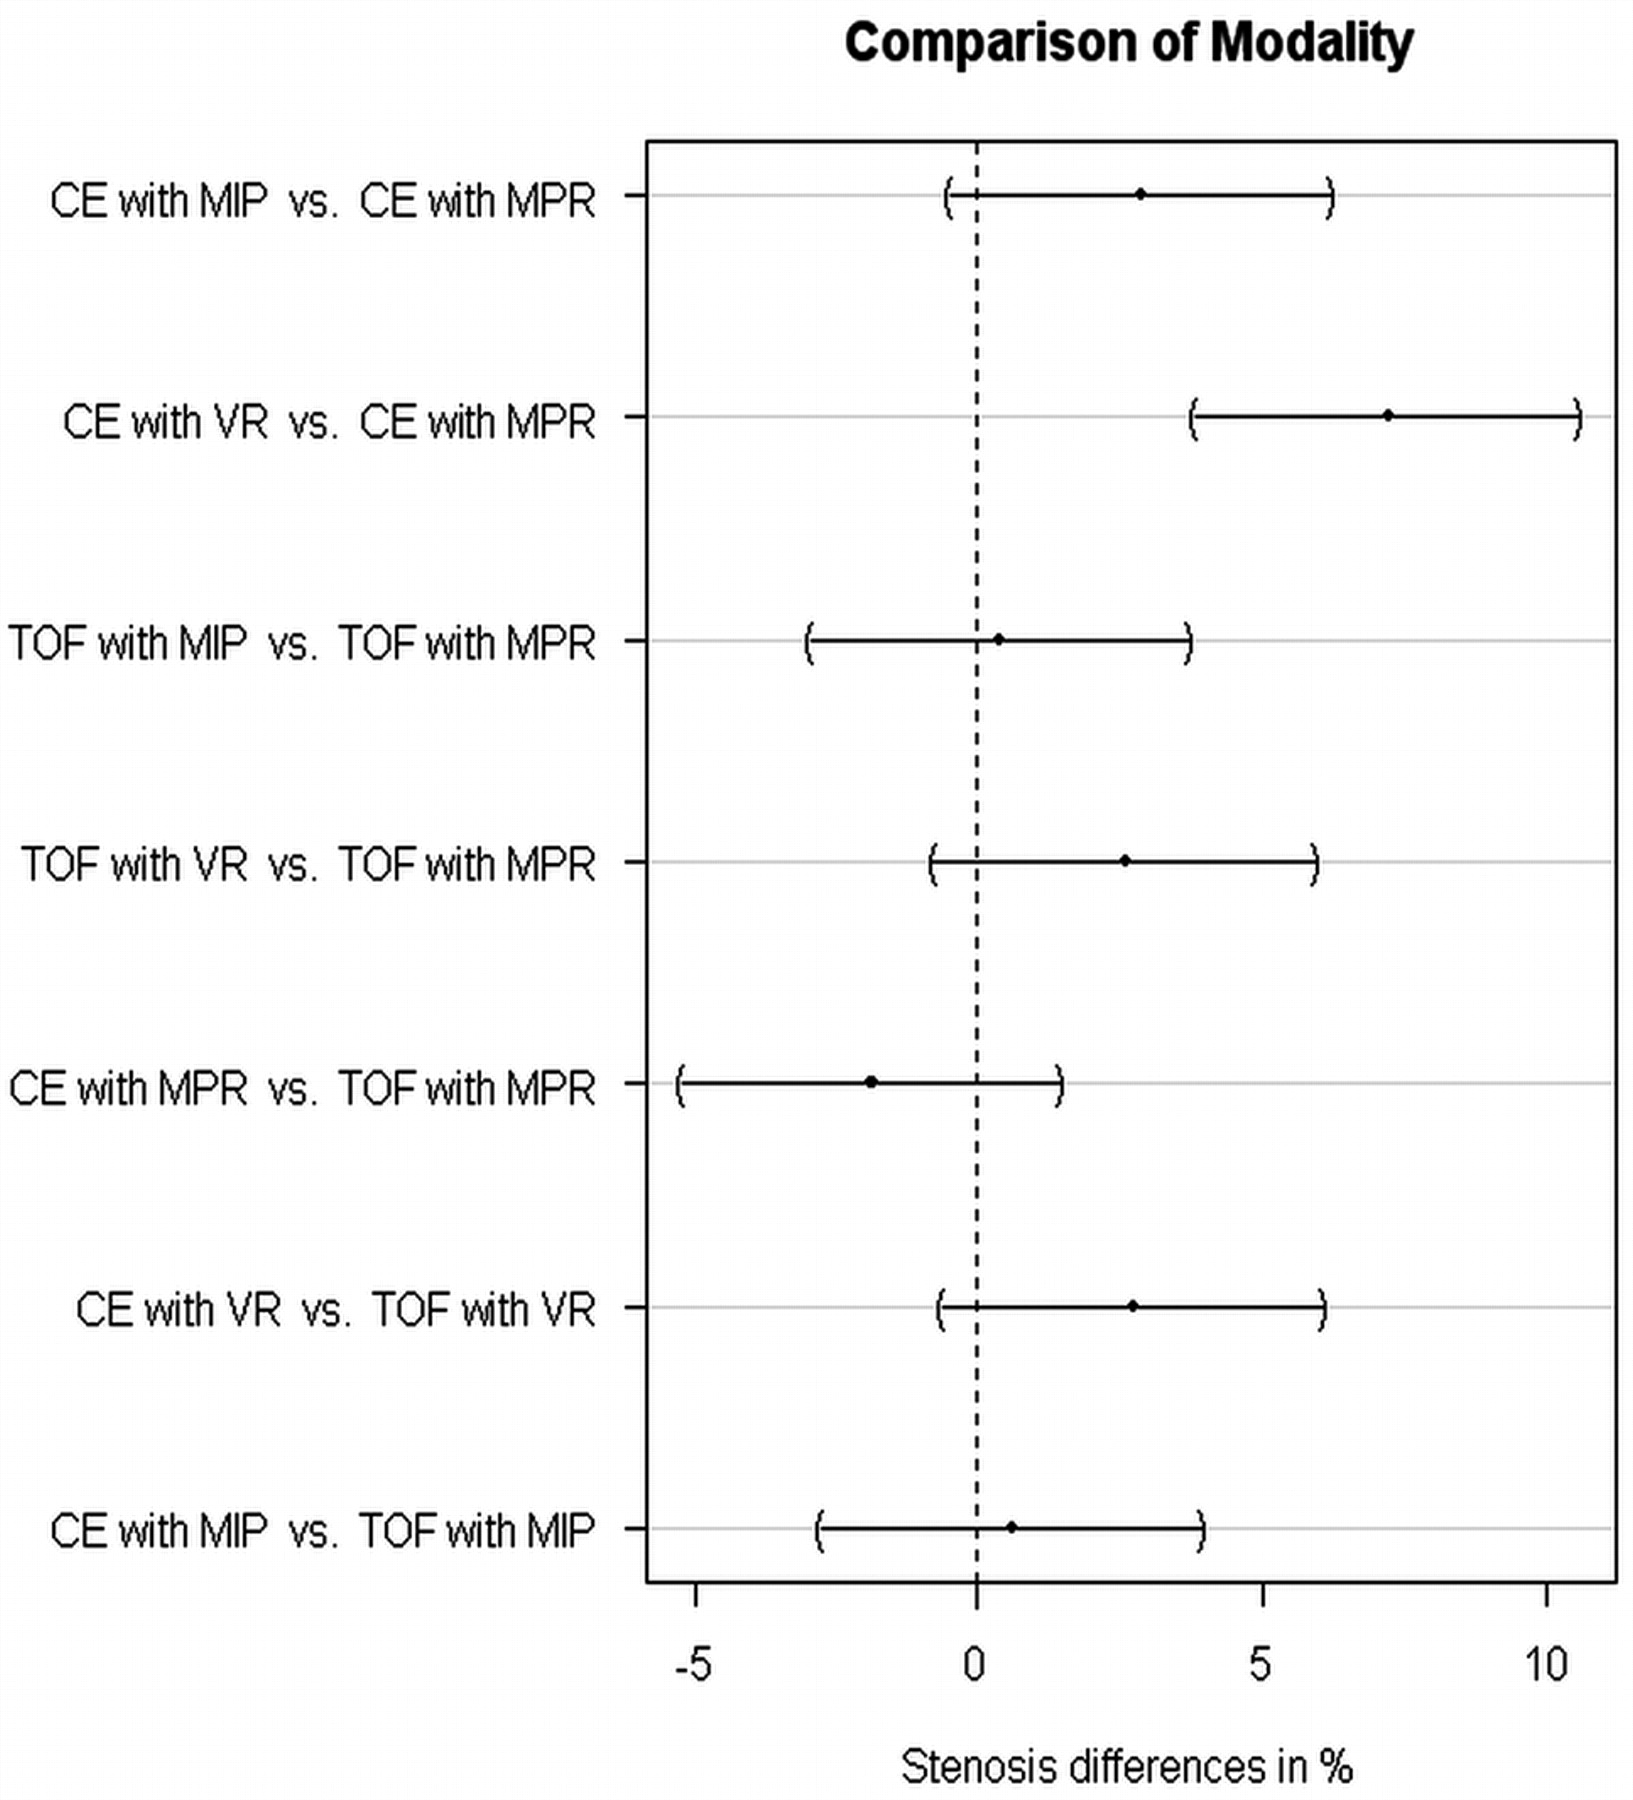
The comparison of the different techniques did not reveal significant differences except for comparison of CE-MPR and CE volume-rendering. Degree and direction of the deviations were estimated by simultaneous 95% CIs for stenosis values (Table 2). The highest agreement between the techniques was found for TOF-MIP and TOF-MPR. Stenosis values obtained with TOF-MPR were 0.4% lower than those with TOF-MIP on average. Comparison of CE volume-rendering and CE-MPR showed the highest deviation in stenosis values, with a significant difference of 7.2% (P < .05). Figure 2 depicts these pairs by means of scatter- and Bland-Altman plots. Figure 3 displays bias and CIs of the deviation between the techniques graphically. Figure 3 and data in Table 2 display a trend toward higher stenosis values if CE-MRA was evaluated with MIP and volume-rendering compared with MPR. TOF-MIP and TOF-MPR revealed almost identical results on average. TOF volume-rendering resulted in higher stenosis values, but the differences were not statistically significant.

Comparison between TOF-MPR and TOF-MIP shows the smallest deviation, and comparison between CE-MPR and CE volume-rendering (VR) shows the highest deviation between ICA stenosis values. Differences are displayed by means of scatterplots (left row) and Bland-Altman plots (right row). CIs of the difference in stenosis values are given as gray bands.

Comparison of techniques by differences between stenosis values. Pairs of techniques that cross the zero line are not considered significantly different. ICA stenosis values differ significantly between CE-MPR and CE volume-rendering (VR).
Mean difference in stenosis values and 95% CI of all symptomatic stenoses for the different techniques
Local signal loss was found in 7 patients, 5 with TOF-MRA and 6 with CE-MRA (Table 3 and Fig 4). In 22 readings, both readers diagnosed local signal loss; in 7 cases, only 1 reader diagnosed a flow void, whereas the other measured a residual lumen. In all patients, the residual lumen corresponded to high-grade stenosis (>70%) in the other reader's results. Near occlusion was diagnosed in 1 patient by both readers. At least with 1 imaging technique, total occlusion was diagnosed in 5 patients.

Stenosis of the right ICA. A, An overview with the CE-MIP method. Enlarged pictures with CE-MIP (B) and CE volume-rendering (C) show local signal-intensity loss with distal enhancement, but residual signal intensity is detectable with TOF-MRA (D, TOF-MIP; E, TOF volume-rendering) and CE-MPR (F, G) at the site of minimal lumen (arrow). With TOF-MRA (D, E), signal intensity is fading at the edge of the scan volume, resulting in artificial lumen reduction.
Number of cases with signal loss diagnosed by at least 1 reader
In 1 of these patients, only TOF images suggested total occlusion, whereas CE images only showed local signal-intensity loss with a patent distal lumen, most likely due to smaller volume coverage in TOF-MRA. One observer reported signal-intensity loss for CE-MPR and CE-MIP, whereas the other measured high-grade stenosis. Both reported flow voids for CE volume-rendering, whereas TOF-MRA showed residual lumen in 1 patient. In another case, both observers reported local signal loss in TOF-MRA and residual lumen with CE-MRA independent of the postprocessing technique used.
To avoid possible bias introduced by assigning a stenosis value in case of local signal loss or near occlusion, we recalculated CIs after exclusion of cases in which at least 1 reader diagnosed 1 of these conditions (Table 2). This did not influence the significance of the results.
Discussion
MRA is increasingly used for detection and grading of carotid artery stenosis. Many studies have been published comparing different imaging techniques,10 but only a few have focused on the effect of postprocessing on stenosis measurement in carotid artery stenosis.21–23 CE-MRA of the carotid arteries may be equivalent to 3D-TOF-MRA24,25 and perhaps even DSA26–28 in detecting severe ICA stenosis (>70%). Sensitivities between 88% and 97% (CE-MRA) and 82% and 92% (TOF-MRA) and specificities between 89% and 96% (CE-MRA) and 76% and 97% (TOF-MRA) have been reported for detection of severe ICA stenosis in a recent meta-analysis.10
CE-MRA has been favored over 3D-TOF because of larger volume coverage and faster acquisition time resulting in fewer motion artifacts. Recent reports suggesting a link between nephrogenic systemic fibrosis and exposure to gadolinium-based contrast agents used at high doses11 favor angiographic techniques that do not require gadolinium-based contrast agents, like 3D-TOF.
We compared 3 different postprocessing methods to assess their influence on stenosis measurement in vivo. Measurements were performed with a digital ruler on a 3D workstation instead of subjective visual impression as proposed by U-King-Im et al.29 Excellent correlation between the readers supports this approach. Interpretation of targeted MIP images combined with source images may be considered the classic approach to evaluate MRA data. Because CE-MRA is usually performed in the coronal plane, stenosis evaluation may be more difficult on CE-MRA source images than on transverse TOF-MRA source images. Multiplanar reformation of MRA data can solve this problem by aligning the image plane perpendicular to the ICA to optimize measurement of eccentric stenosis.30 The disadvantages of MPR evaluation are the inferior 3D visualization of the vessels and higher time demand to adjust the image planes. Volume-rendering techniques optimally visualize vessels in 3 dimensions, but the parameter setting of the transfer function is critical for morphologic measurements.31 If TOF-MRA and CE-MRA were postprocessed with the same method, no significant differences in stenosis values were found, though there was a trend toward lower stenosis values with TOF-MRA compared with CE-MRA when they were postprocessed with MPR and MIP. The highest concordance was found for the comparison of TOF-MIP and TOF-MPR followed by TOF-MIP and CE-MIP. MRA postprocessed with volume-rendering resulted consistently in higher stenosis values compared with MIP or MPR postprocessing, though only the differences between CE volume-rendering and CE-MPR were statistically significant.
The phenomenon of local signal loss is related to a variety of effects (eg, spin-dephasing or partial volume effects, or choice of imaging parameters).12,32–34 The smaller voxel size of 0.26 mm3 in TOF-MRA versus 0.55 mm3 in CE-MRA might account for the lower incidence of signal losses in TOF-MRA compared with CE-MRA. Image postprocessing and window-level setting may be critical factors that influence the frequency of local signal loss. We found conflicting results in 7 cases, in which 1 reader diagnosed local signal loss and the other reader still detected a measurable lumen. In each case, a high-grade stenosis (>70%) was diagnosed by the second observer.
Intravascular signal intensity may be better perceived with MPR than MIP in case of severe stenosis.35,36 This difference could explain the higher incidence of flow voids in MIP studies compared with MPR studies. Volume-rendering studies were generated by using predefined settings as described previously. Sliding the trapezoid toward lower intensity values on the voxel histogram leads to visualization of structures with lower signal-intensity values and, thereby, increases the diameter of vessels. The definition of the trapezoid (its width, height, and position) strongly affects vascular lumen measurements.31 To make individual results comparable, we used a preset for volume-rendering but allowed readers slight adjustments to compensate for differences in signal-intensity between individual examinations. The higher number of flow voids compared with MPR studies in both acquisition techniques suggests that volume-rendering may be less sensitive to subtle vascular signals, at least with our parameter settings.
Better perceptibility of residual lumen has been reported for a combination of source and MIP images.37,38 Comparison between MPR and MIP of 3D-TOF-MRA showed slightly higher stenosis values for MIP23 but not at a significant level. De Marco et al21 found no significant difference between MPR of 3D-TOF-MRA and DSA, whereas MIP overestimated the degree of stenosis. The tendency to overestimate the degree of stenosis can be reduced by the use of source images or MPRs.36 These results are concordant with our finding that MPR shows a trend toward lower degrees of stenosis for both 3D-TOF-MRA and CE-MRA compared with MIP or volume-rendering, with significantly lower stenosis values for comparison of CE-MPR and CE volume-rendering.
To our knowledge, only a small amount of data has been published examining volume-rendering in the measurement of extracranial ICA stenosis.31,39 Mallouhi et al40 reported that volume-rendering is superior in the detection of intracranial artery stenosis compared with MIP because MIP images exaggerate the degree of stenosis. Our data do not support this finding, probably due to different volume-rendering presets.
The value of CE-MRA has been discussed controversially. CE-MRA provides a shorter examination time, leading to a reduction of motion artifacts, and has a larger volume coverage. On the other hand, it has lower spatial resolution. With advances in MRA techniques, recent reports suggest that the diagnostic performance24 and accuracy25,26 of 3D-TOF-MRA and CE-MRA are comparable. This conclusion is in line with our findings that stenosis values between identical postprocessing methods in different techniques did not differ significantly.
The absence of DSA as the standard of reference might be regarded as a limitation of our study. Our aim was to evaluate the concordance of different MRA techniques and the influence of postprocessing. Therefore, we did not include other imaging techniques such as x-ray angiography to avoid bias introduced by the imaging technique itself.
In conclusion, our results indicate that the interobserver agreement for stenosis measurement is very high regardless of the postprocessing method and acquisition technique used. Multiple comparisons between postprocessing methods and techniques show no significant differences except for CE-MPR versus CE-volume-rendering (P < .05), with CE volume-rendering resulting in higher stenosis values. Although not statistically significant, MPR shows the fewest cases of local signal-intensity loss and, therefore, seems to depict vessel lumen more exactly than calculated projections.
References
- Received October 20, 2007.
- Accepted after revision April 23, 2008.
- Copyright © American Society of Neuroradiology


