
Abstract
BACKGROUND AND PURPOSE: In the search for a diagnostic marker in ALS, we focused our attention on the hyperintense signal intensity in T1 MTC MR images along the CST, detected in some patients and not found in other patients with ALS and in control subjects. The aim of this study was to investigate the relationship between the hyperintense signal intensity in T1 MTC images and white matter damage. To this purpose, we studied potential heterogeneities in DTI values within our patients by using TBSS without a priori anatomic information.
MATERIALS AND METHODS: In 43 patients with ALS and 43 healthy control subjects, the presence or absence of T1 MTC hyperintense signal intensity was evaluated. With a DTI analysis with a TBSS approach, differences in FA distribution between the 2 groups (patients with T1 MTC hyperintense signal intensity and patients without it) compared with each other and with control subjects were investigated.
RESULTS: We found regional differences in white matter FA between patients with T1 MTC hyperintense signal intensity (37.2%) and patients without it. Patients with T1 MTC abnormal signal intensity showed lower FA strictly limited to the motor network and the posterior aspect of the body of the CC without extramotor FA reductions, whereas patients without this sign showed FA reductions in several confluent regions within and outside the CST and in the whole CC.
CONCLUSIONS: T1 MTC hyperintense signal intensity in the CST and posterior CC, when present, is specific for ALS and represents, among patients with ALS, a possible distinct phenotype of presentation of the disease with prominent UMN involvement.
ABBREVIATIONS:
- ALS
- amyotrophic lateral sclerosis
- CC
- corpus callosum
- CST
- corticospinal tract
- FA
- fractional anisotropy
- FMRIB
- Functional MR Imaging of the Brain
- FSL
- FMRIB Software Library
- LMN
- lower motor neuron
- MNI
- Montreal Neurological Institute
- MT
- magnetization transfer
- MTC
- magnetization transfer contrast
- MTR
- magnetization transfer ratio
- PD
- proton attenuation
- PLS
- primary lateral sclerosis
- SE
- spin-echo
- TBSS
- tract-based spatial statistics
- UMN
- upper motor neuron
ALS is a chronic neurodegenerative disease that selectively involves the motor system. Clinically, patients present with UMN and LMN signs and symptoms. Degeneration of the UMNs in the precentral gyrus of the cerebral cortex is the main pathologic change, accompanied by degeneration of the CST from the cerebral cortex to the spinal cord.1,2
The incidence of sporadic ALS ranges between 1.5 and 2.7 per 100,000 population/year (average 1.89 per 100,000/year) in Europe and North America.3⇓⇓⇓–7
In patients with ALS, MR imaging of the brain may show signal-intensity abnormalities, namely a hyperintense signal intensity in PD-T28⇓–10 and FLAIR11⇓⇓–14 MR images in the CST from the white matter of the precentral gyrus through the corona radiata and posterior limb of the internal capsule down to the brain stem, consistent with CST degeneration.
In addition, a hypointense rim in the posterior aspect of the precentral gyrus attributed to iron accumulation has been found.12,13,15⇓–17
Only a few authors have specifically studied T113,16,18 and T1 MTC sequences, finding either a hyperintense signal intensity18 or a reduction of MTR along the CST,19,20 suggesting the presence of a more severe tissue damage. MTC imaging focuses on fundamental relaxation properties of water protons and is applied to augment image contrast and tissue specificity. This technique is based on the application of off-resonance radio frequency pulses before the pulse sequence to preferentially saturate immobile protons of macromolecules, which then transfer magnetization to mobile protons in free water and can be used to detect changes in the structural status of the brain tissue.21
MT imaging of the gray matter of patients with ALS recently showed a reduction of MTR in the precentral gyrus and also in the prefrontal and temporal cortices.22
In our experience, T1 MTC hyperintense signal intensity of the CST is a characteristic but inconstant finding in patients with ALS. On the hypothesis that this feature could correspond to a specific disease phenotype, we used MT imaging of the white matter of patients with ALS, focusing our attention on the T1 MTC signal intensity along the CST. To further characterize the relationship between the hyperintense signal intensity in T1 MTC and the white matter damage, we followed a DTI approach. Among in vivo neuroimaging techniques, DTI is in fact the criterion standard method to assess the structural integrity of white matter. Diffusion anisotropy describes how variable the diffusion is in different directions and is most commonly quantified via a measure known as FA.23,24 A decrease in FA has been shown to be related to axonal fiber degeneration and myelin breakdown.25
In this article, we used TBSS,26 a voxel-based approach that uses extracted and skeletonized white matter tracts in the FA images of all subjects. TBSS is used in an effort to overcome the problems associated with the use of standard registration algorithms in other voxel-based approaches.
Several DTI studies have reported reduced FA in the CSTs of patients with ALS, though the extent and distribution of these changes have been variable.26⇓⇓⇓⇓⇓⇓⇓⇓⇓⇓⇓⇓–39 Reduced FA along the CST from the corona radiata through the internal capsule and into the brain stem has been reported by using both region-of-interest27,32,36 and voxel-based approaches.28,33,35,38,40
In addition, some authors28,35 described a decrease in FA, not only in the CST but also in regions outside the main motor cortices and the CST. In previous studies that used TBSS, FA reductions were found in regions outside the motor network, such as the CC and the white matter underneath the premotor, primary sensory, frontal, and prefrontal cortices.37,38 In another DTI study by using TBSS, the authors reported FA reductions in the body and genu of the CC and corona radiata in patients with ALS compared with controls, and mean diffusivity, axial diffusivity, and radial diffusivity increased in regions outside strictly motor areas.39
The aim of our investigation was to explore the relationship between the hyperintense signal intensity in T1 MTC and white matter damage in a series of patients with ALS by using a TBSS approach and to establish whether there were regional differences in white matter FA between patients with T1 MTC hyperintense signal intensity and patients without it.
Materials and Methods
Patients
Between February 2010 and January 2011, 43 patients with ALS (26 men, 17 women) with probable or definite ALS as defined by the El Escorial criteria41 were studied. The mean age of these patients was 63.0 ± 11.2 years; range, 33–79 years; the mean ALS functional rating scale was 40.7± 5.0; range, 21–48. The mean time from symptom onset to the time of scanning (disease duration) was 14.24 ± 7.7 months; range, 3–33 months. Their mean rate of disease progression was 1.06 U/month. Symptom-onset region was the bulbar segment in 16 and spinal in the other 27 patients. Thirteen patients had prevalent UMN ALS, 7 had prevalent LMN ALS, and the remaining 23 did not demonstrate any prevalence of UMN or LMN symptoms.42 Patients were included in the study if they had no history of other neurologic and/or vascular diseases. For comparison, 43 sex- and age-matched healthy controls (mean age, 59.7± 14.9 years) were also studied. All subjects gave informed, written consent before the study, which was approved by the local research ethics committees.
MR Imaging Acquisition
All subjects were imaged on a Signa HDxt EchoSpeed 1.5T scanner (GE Healthcare, Milwaukee, Wisconsin) with a maximum gradient strength of 33 mT/m, maximum slew rate of 120 T/m/s, and an 8-channel phased array head coil. In all patients, sagittal and axial T1 imaging (TR, 500 ms; TE, 14 ms) and sagittal and axial T1 imaging with MTC (TR, 480 ms; TE, minimum full; MT pulse, 1200 Hz; off-resonance, 1) was performed. In addition with an SE technique, axial PD T2-weighted (TR, 2860 ms; TE, 1, minimum full; TE, 2 120 ms) and coronal FLAIR images (TR, 8000 ms; TE, 80 ms; TI, 2000 ms) were obtained. Regarding all the sequences detailed above, other imaging parameters included a 24-cm FOV, 5-mm section thickness, 1 mm of spacing, and a 224 × 256 matrix.
We acquired a DTI SE EPI sequence (diffusion-weighted single-shot SE echo-planar imaging) with a data-acquisition matrix of 96 × 96; FOV, 240 × 240 mm; TR, 12,000 ms; TE, minimum full; NEX, 1; parallel imaging factor, 2; 46 contiguous axial sections; section thickness, 2.5 mm; spacing, 0; 2.5-mm isotropic voxels covering the entire brain and the brain stem. A pair of diffusion gradients was applied along 25 noncollinear directions with a b-value of 1000 s/mm2. The resulting scanning time was 5 minutes, 24 seconds.
A 3D magnetization-prepared rapid acquisition of gradient echo sequence (preparation time, 600 ms; acquisition matrix, 240 × 240; FOV, 240 × 240 mm; 140 one-millimeter thickness partitions covering the whole brain and brain stem with a resulting isotropic voxel of 1 mm; parallel imaging factor, 2; scan duration, 2 minutes, 52 seconds) was consequently acquired.
MR Imaging Analysis
T1 MTC.
In each MR imaging examination, signal-intensity alterations along the CST and posterior body of the CC were identified and scored as absent (0) or present. (1) This was done separately for the subcortical precentral gyrus, the centrum semiovale, the posterior aspect of the CC, and the posterior limb of the internal capsule. All images were evaluated and reviewed by 2 experienced neuroradiologists blinded to the results and neurologic diagnosis (patients with ALS versus controls).
DTI Processing and TBSS.
The diffusion tensor was calculated on a voxel-by-voxel basis.23 Before running TBSS, we corrected the DTI acquisition for eddy currents and head-motion distortions (by using the FSL program Eddy Correct, http://www.fmrib.ox.ac.uk/fsl), and FA maps were obtained by using the Frequent Domain Transform Toolbox in FSL.43,44 Then a voxelwise statistical analysis of the FA maps by using TBSS was performed as described in detail in a previous article.26 The main steps of the analysis were as follows:
Alignment of FA Images to Standard Space.
Each individual FA image was aligned into 1 × 1 × 1 mm MNI 152 standard space in 3 steps:
1) By identifying a single subject FA “target” image, to which every FA image was nonlinearly aligned
2) By aligning the target image to the MNI 152 standard space by using affine transformation, and
3) By transforming each individual FA image into the MNI 152 standard space by using both the nonlinear and affine transformations estimated in the previous steps.45
Creating the Mean FA Image and Its Skeleton
The transformed individual FA images were averaged to create a mean FA image. This mean image was then “thinned” to create an FA skeleton, which represents the tracts that are “common” to all subjects. Finally, this FA skeleton was thresholded (by using the voxelwise mean FA across subjects) to discard areas in which a good tract correspondence between subjects was not achieved and to exclude all voxels that are primarily gray matter or CSF in most subjects. The aim of this thresholding was to define the set of voxels to be included in the voxelwise cross-subject statistics. The threshold that we used was FA = 0.2.
Projecting Individual FA Maps onto the Skeleton.
Each subject's aligned FA image was, in turn, projected onto the mean FA skeleton, by using the maximum FA value in a search perpendicular to the skeleton. This step resulted in a 4D image (“skeletonized”), which has the subject as a fourth dimension; this image was then used in the voxel-based statistics across subjects.37
Statistical Analysis
We investigated differences in FA between the 2 groups by using a 2-sample t test. We estimated 2 contrasts: a group greater than the other and vice versa. The resultant statistical maps were thresholded at P < .05, corrected at the cluster level for multiple comparisons by using a permutation-based approach.46 We tested the hypothesis that there were significant differences in FA: 1) between patients with T1 MTC hyperintense signal intensity along the CST and patients without it; 2) between patients with T1 MTC hyperintense signal intensity and healthy controls; 3) between patients without T1 MTC hyperintense signal intensity and controls.
The mean FA values of the CST and CC were extracted for each subject by using an atlas-based mask for the regions of interest developed at the Johns Hopkins University (JHU-ICBM, Baltimore, Maryland).47 The CST was evaluated entirely and from the precentral gyrus to the internal capsule; the CC was evaluated entirely and divided in the genu, body, and splenium; and the body was divided in the anterior body and posterior body. For the white matter outside the CST (frontal white matter, parietal white matter, temporal white matter), the mean FA was also calculated on the basis of regions of interest derived from MNI templates.
For bilateral regions, the value of FA from the left and right side was averaged. Before averaging bilateral regions, unilateral measurements were achieved and no differences were found.
Results
T1 MTC Results
The hyperintense signal intensity in T1 MTC in our patients with ALS was present in 37.2% (16/43) of patients and was absent in 62.7% (27/43) (Table 1 and Fig 1). This signal intensity was absent in control subjects. Thus, T1 MTC hyperintensity in our patients with ALS had a low sensitivity, with a negative predictive value of 0.61, and a high specificity, with a positive predictive value of 1.
Sensitivity and specificity of T1 MTC hyperintense signal in patients with ALS and controls

T1 MTC MR sagittal (A and B) and axial (C) images show a hyperintense signal intensity along the CST and in the posterior aspect of the CC (B).
Difference in FA between Patients with T1 MTC Hyperintense Signal Intensity along the CST and Patients without It
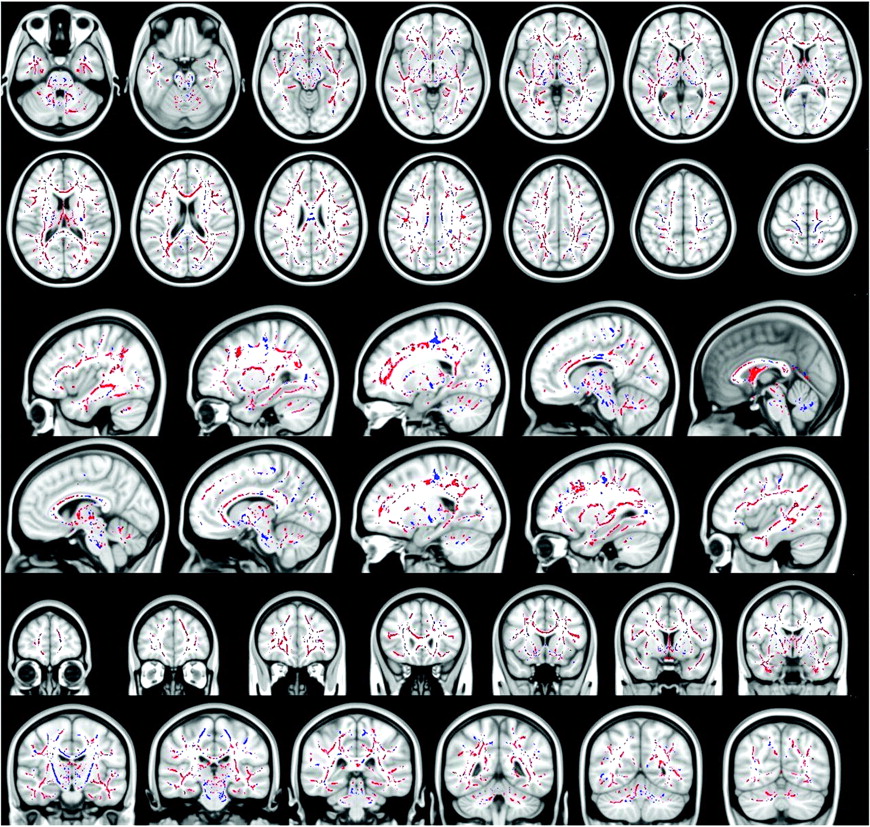
Patients with T1 MTC hyperintense signal intensity along the CST had significantly lower FA (all P values <.01) compared with patients without T1 MTC hyperintensity (Table 2 and Fig 2). In particular, lower FA was found bilaterally from the subcortical precentral gyrus passing through the centrum semiovale, the posterior limb of the internal capsule, the pons, and middle cerebellar peduncle. Regarding the CC, patients with T1 MTC hyperintense signal intensity along the CST compared with patients without it showed a significantly lower FA only in the posterior aspect of the body of the CC (T1 MTC hyperintense mean FA 0.528 ± 0.015 versus T1 MTC absent mean FA 0.536 ± 0.015), whereas they showed higher FA in the entire CC, in the splenium, in the genu, and in the anterior body (mean FA in the entire CC T1 MTC hyperintense, 0.580 ± 0.018, versus T1 MTC absent mean FA, 0.569 ± 0.018). Most interesting, in the regions outside the CST (the white matter adjacent to the superior and middle frontal gyrus, the parietal and temporal white matter, the anterior limbs of internal capsule, and the external capsule), the patients with T1 MTC high signal intensity showed increased FA (mean FA in the frontal white matter, 0.243 ±0.014; mean FA in the temporal white matter, 0.268 ± 0.013; mean FA in the parietal white matter, 0.236 ± 0.016) compared with the group of patients without T1 MTC hyperintense signal intensity (mean FA frontal white matter, 0.234 ± 0.013; mean FA in the temporal white matter, 0.245 ± 0.012; mean FA in the parietal white matter, 0.212 ±0.015).
Mean FA of clusters with statistically significant differences between patients with ALS with T1 MTC hyperintense signal and those without it and controlsa

Blue voxels show the regions within and outside the CST, where the FA is significantly reduced in patients with ALS with T1 MTC hyperintense signal intensity compared with patients with ALS without T1 MTC hyperintense signal intensity (all P values < .05, corrected at the cluster level). Red voxels show the regions where the FA is significantly increased in patients with ALS with T1 MTC hyperintense signal intensity compared with patients with ALS without T1 MTC hyperintense signal intensity (all P values < .05, corrected at cluster level). In the CC, patients with T1 MTC hyperintense signal intensity compared with patients without T1 MTC hyperintensity show a significantly lower FA only in the posterior aspect of the body of the CC, whereas they show higher FA in the entire CC, in the splenium, in the genu, and in the anterior body.
Difference in FA between Patients with ALS with T1 MTC Hyperintense Signal Intensity and Controls
Patients with ALS with and without T1 MTC hyperintense signal intensity along the CST had significantly lower FA (all P values <.05) in several confluent regions within and outside the CST compared with healthy controls. These results are consistent with previous DTI studies.28,35 In particular, lower FA was found bilaterally in the pons, middle cerebellar peduncle, posterior limb of the internal capsule, the centrum semiovale, and subcortical precentral gyrus. Patients also showed a significantly lower FA throughout the white matter of both hemispheres, in particular underneath the premotor, primary sensory, frontal, and prefrontal cortices, adjacent to the superior and middle frontal gyri, in the parietal and temporal white matter, and in the anterior limbs of the internal and the external capsules. A marked reduction of FA was found throughout the entire CC.
Difference in FA between Patients with ALS without T1 MTC Hyperintense Signal Intensity and Controls
The results were comparable with those previously obtained between patients with T1 MTC hyperintense signal intensity and healthy controls.
Correlations between the Presence of T1 MTC Hyperintense Signal Intensity and the Prevalence of UMN or LMN Symptoms
A further post hoc investigation of a correlation between the presence of T1 MTC hyperintense and clinical presentation showed that 8 of our patients with T1 MTC had clinical features of UMN dysfunction; 1 had clinical features of LMN dysfunction and the remaining 7 did not demonstrate any prevalence of UMN or LMN symptoms.
Correlations between the Presence of T1 MTC Hyperintense Signal Intensity and ALS Functional Rating Scale and Disease Duration
No significant correlation was found between the T1 MTC hyperintense signal intensity and ALS Functional Rating Scale and disease duration.
Discussion
An abnormal signal intensity along the CST on T113,16,18 and T1 MTC sequences,18⇓–20 implying the presence of tissue damage, has been described. High signal intensity in T1 MTC images along the CST and posterior aspect of the CC was found in 16 of our 43 patients with ALS and in none of the control subjects, with a specificity of 100% but a low sensitivity (37.2%). MTC sequences reflect the structural variations within a tissue, and in several diseases, MTC images may indicate the presence of structural changes in the tissue, such as edema and demyelination. The cause of the high signal intensity on T1 MTC images along the CST is unknown; some authors have suggested that the pathologic changes seen in ALS, such as axonal degeneration and myelin breakdown20 or the presence of lipid-laden macrophages and an accumulation of intra-axonal neurofilaments48 may contribute to the T1 MTC shortening.16 Another interesting and intriguing hypothesis is the presence of toxic metals such as manganese, which is also known to determine a T1 MTC shortening effect on MR imaging.49,50
Regarding DTI, the most interesting result of this study is that there were regional differences in white matter FA between patients with T1 MTC hyperintense signal intensity and patients without it. Patients with T1 MTC abnormal signal intensity showed lower FA strictly limited to the motor network and the posterior aspect of the body of the CC without extramotor FA reductions, whereas patients without this sign showed FA reductions in several confluent regions within and outside the CST (frontal, temporal, parietal lobes) and in the whole CC.
Furthermore, we focused on the different clusters of FA reductions detected between those patients with T1 MTC high signal intensity and those without it. In particular, trying to better understand the T1 MTC signal intensity abnormalities in the posterior aspect of the body of the CC, we demonstrated a significant FA decrease in this specific segment of the CC (with a sparing of the remaining CC segments, thus suggesting a more severe, focal, interhemispheric fiber damage) in those patients with T1 MTC hyperintense signal intensity compared with those without it. On the other hand, those patients without T1 MT hyperintense signal intensity showed widespread FA reductions in the entire CC, not restricted to the posterior aspect compared with controls.
Reductions of FA in the CC have been described in other studies in ALS, though the extent and distribution of these changes have been variable.28,40,51 In a recent TBSS analysis of patients with ALS, reductions in FA in the splenium and body of the CC in addition to the previously reported reductions in FA in the CST have been reported,38 and a reduction in FA in the CC of the ALS group, extending rostrally and bilaterally to the region of the primary motor cortices, independent of the degree of clinical UMN involvement, has been also described.52
The isthmus of the CC is frequently involved in ALS and in other conditions such as adult-onset Krabbe disease53; this region harbors interhemispheric fibers connecting the 2 motor cortices and is occupied by the motor inhibitory pathways.54 Thus, such transcallosal fiber damage might imply a loss of motor inhibition and explains the clinical finding of increased involuntary contralateral co-movements in patients with ALS.51,55,56
In our 16 patients with the T1 MTC hyperintense signal intensity in the posterior body of the CC, we demonstrated significantly lower FA compared with controls and with patients with ALS without T1 MTC hyperintense signal intensity, suggesting more severe interhemispheric fiber damage.
A previous ALS study using TBSS concluded that central CC FA reductions observed were able to discriminate PLS from ALS.37 DTI studies of patients with hereditary spastic paraparesis have also demonstrated prominent posterior CC involvement, notably not detected in the LMN-only slowly progressive disorder (ie, X-linked spinobulbar muscular atrophy).57 It has been reported that in ALS and PLS, there is a loss or shrinkage of Betz cells in the premotor cortex, but the cortical motor neurons seem to degenerate more in PLS than ALS.58 Therefore, all these findings together support the hypothesis that the T1 MTC hyperintense signal intensity, when present, expresses a distinct ALS phenotype characterized by a more severe cortical motor neuron degeneration, with a more prominent “dying back” degeneration of neurons of the CST. Furthermore, in this subgroup of patients, the degeneration of collaterals of the CST at the level of corticocortical motor interhemispheric fibers is more pronounced, confirmed by lower FA in the posterior aspect of the body of the CC compared with patients with ALS without the T1 MTC signal intensity. The fact that in patients without T1 MTC hyperintense signal intensity the FA reductions were spread throughout several extramotor white matter tracts and the entire CC, confirms what some authors have proposed, that the CC might be a “conduit” for the pathologic diffusion of the disease to the frontal areas, explaining cognitive dysfunction present in some patients with ALS.52
The major limitations in this study are related to the DTI approach: Though TBSS for analysis of DTI data holds several advantages, it may not suffice to circumvent systematic errors such as partial volume effects, especially in very thin structures such as the fornix and external capsule. Although by using TBSS, we sampled diffusivity values from the centers of the tracts, some voxels located on the white matter skeleton were within the crossings of different fiber pathways. In these voxels, FA cannot serve as a marker of myelin and axon integrity, and the patterns should be interpreted with caution.
Further investigation is necessary to explore the differences between this group and other patients with ALS with extramotor FA reduction, by correlating the MTC findings with clinical, neuropsychological, MR spectroscopy, and pathologic findings. The data must be replicated.
Conclusions
The T1 MTC hyperintense signal intensity in the CST and posterior body of the CC, when present, is specific for ALS and represents, among patients with ALS, a possible distinct phenotype of presentation of the disease very similar to that in UMN disorders, such as PLS, being characterized by FA reduction strictly in the motor network and in the posterior aspect of the body of CC, without extramotor FA reductions demonstrated in patients without this sign. We believe that this sequence should be included in the diagnostic work-up of patients with ALS.
Acknowledgments
We thank the patients attending the Turin ALS center who agreed to participate in this study. We also thank Mario Savoiardo, Milan, for his helpful advice in manuscript preparation.
Footnotes
-
The research leading to these results was funded by Compagnia di S. Paolo Programma Neuroscienze 2008–2009 and the Health Seventh Framework Programme of the European Community (FP7/2007–2013) under grant agreement No. 259867.
-
Disclosures: Adriano Chiò—UNRELATED: Board Membership: Biogen, Comments: Advisory board, dexpramipexole ALS study.
Indicates open access to non-subscribers at www.ajnr.org
References
- Received June 8, 2011.
- Accepted after revision July 27, 2011.
- © 2012 by American Journal of Neuroradiology
In this issue


Jump to section
Related Articles
Cited By...
- A distinct imaging phenotype in amyotrophic lateral sclerosis confidently detected on T1 MTC
- Corticospinal Tract MR Signal-Intensity Pseudonormalization on Magnetization Transfer Contrast Imaging: A Potential Pitfall in the Interpretation of the Advanced Compromise of Upper Motor Neurons in Amyotrophic Lateral Sclerosis