
Abstract
BACKGROUND AND PURPOSE: Type 2 diabetes is associated with an increased risk of dementia. This study investigated the global connectivity patterns in the brains of patients with type 2 diabetes by using a functional MR imaging technique.
MATERIALS AND METHODS: Forty patients and 43 age-, sex-, and education-matched healthy controls underwent resting-state functional imaging in a 3T MR imaging unit. Degree centrality, a commonly used measurement of global connectivity, was computed for a full-brain exploration of the regions influenced by type 2 diabetes. We then examined the functional connectivity of each region by using the seed-based approach. Finally, voxelwise correlation analyses were performed to explore the relationship among the connectivity changes, cognitive performance, and diabetes-related variables.
RESULTS: Patients exhibited decreased degree centrality in the left lingual gyrus and increased centrality in the right insula and dorsal anterior cingulate cortex (corrected P < .05). The occipital network anchored in the lingual gyrus showed extensively reduced connectivity, while the network connectivity of the insula and cingulate cortex (mostly included in the salience network) was significantly elevated (corrected P < .05). Correlational analyses revealed that in the diabetic group, impaired visual memory and executive function performance were correlated with occipital hypoconnectivity, while higher fasting plasma glucose levels and better executive functioning were related to anterior cingulate cortex hyperconnectivity (all corrected P values < .05). Similar effects were not detected in the controls.
CONCLUSIONS: This preliminary study shows that network connectivity is altered in patients with type 2 diabetes, which may provide critical insight into the neural substrate of diabetes-related cognitive decline.
ABBREVIATIONS:
- CFT
- Complex Figure Test
- dACC
- dorsal anterior cingulate cortex
- DC
- degree centrality
- FC
- functional connectivity
- FPG
- fasting plasma glucose
- HbA1c
- glycosylated hemoglobin
- HC
- healthy control
- T2DM
- type 2 diabetes mellitus
- TMT
- Trail-Making Test
It has been suggested that type 2 diabetes mellitus (T2DM) is associated with cognitive dysfunction and a higher risk of dementia, especially in elderly subjects.1,2 However, the neural substrate of T2DM-related cognitive impairment remains elusive. Because brain pathologies may precede clinically measurable cognitive deficits,3 identifying vulnerable brain regions might be advantageous for tracking the early effects of T2DM on cognitive functioning.
The human brain consists of spatially distributed but functionally interacting regions that form an efficient functional connectome to support normal cognitive functioning.4 Recent studies on patients with Alzheimer disease suggest that altered functional connectivity (FC) between regions may represent early deleterious outcomes that occur before structural changes and clinical manifestations.5 However, only a limited number of studies have explored FC changes in relation to T2DM so far: One study reported a decreased FC of the hippocampus, while another study observed alterations in thalamocortical connections.6,7 Other studies on this topic focused on the changes either within the default mode network8⇓–10 or in the attentional network.11 Notably, these studies relied on seed-based approaches or an independent component analysis, focusing their examinations within specific brain networks. Based on pathologic evidence, neural degeneration in the brains of those with diabetes is diffusely distributed.12 Therefore, a voxelwise whole-brain FC analysis may yield a more comprehensive understanding of the functional alterations related to the disease.
Degree centrality (DC) is a commonly used graph theory–based measurement of global connectivity. It computes the correlation of each voxel with all other voxels in the entire brain, resulting in a connectivity map that represents the sum (attenuation) of connections at each voxel.13 Recent studies from our group have demonstrated that DC is highly associated with regional cerebral blood flow and metabolism, which establish the physiologic basis of this topologic measurement.14 So far, DC analyses have been applied to various mental disorders, such as Alzheimer disease, schizophrenia, and autism.15⇓–17 In this study, we used DC measurements to perform a full-brain exploration of brain regions with altered connectivity density. The FC pattern of each region was subsequently examined by using a seed-based approach. Finally, correlations among the connectivity in each brain circuit, cognitive performance, and T2DM-relevant variables were explored to better understand the link between network dysfunction and cognitive deficits.
Materials and Methods
Participants
The current study was approved by the ethics committee of the institutional review board of Zhongda Hospital, Southeast University. Written informed consent was obtained from all subjects before their participation. Patients with T2DM and age-, sex-, and education-matched healthy controls (HCs) were recruited via advertisement in the local community. All subjects were between 50 and 75 years of age, with a minimum education of 6 years. The exclusion criteria were as follows: a history of alcohol or substance abuse, Mini-Mental State Examination score of <24,18 a Hamilton Depression Rating Scale score of ≥7,19 a history of brain lesions such as tumor or stroke, an unrelated psychiatric or neurologic disorder, or MR imaging contraindications.
The diagnosis of T2DM was made on the basis of medical histories, medication used, or fasting plasma glucose (FPG) levels (≥7 mmol/L).20 None of the patients reported any history of hypoglycemic episodes or had been diagnosed with clinically detectable complications such as retinopathy, nephropathy, and peripheral neuropathy. HCs underwent an oral glucose tolerance test (75 g of dextrose monohydrate in 250 mL of water). HCs with fasting blood glucose levels of ≥7.0 mmol/L or post-oral glucose tolerance test glucose levels of ≥7.8 mmol/L were excluded.
Information on medical histories and medication use was collected, and weight, height, and waist circumferences were carefully recorded for all subjects. Hypertension was defined as previously described.21 Blood samples were collected after an 8-hour fast to assess FPG, glycosylated hemoglobin (HbA1c), fasting insulin, and cholesterol levels. The homeostasis model assessment of insulin resistance was used to assess the degree of insulin resistance for all HCs and patients who were not treated with insulin.22
The final study sample included 40 patients with T2DM (mean age, 60.5 ± 6.9 years; 21 women) and 43 HCs (57.6 ± 6.6 years, 30 women) (Table 1), who were 50–75 years of age. Among the patients, disease duration ranged from 2 to 17 years (mean duration, 8.9 ± 5.0 years). Eight patients with T2DM received insulin treatment, while the others were treated with either oral hypoglycemic agents (n = 22) or dietary restrictions (n = 10).
Demographics and clinical characteristics for T2DM and control groupsa
Neuropsychological Tests
All participants were subjected to a detailed battery of neuropsychological tests, which covered multiple cognitive domains. Episodic memory regarding verbal and visual information was assessed via the Auditory Verbal Learning Test and the Rey-Osterrieth Complex Figure Test (CFT) delayed recall trial, respectively. Working memory was measured via the forward and backward trials of the Digit Span Test. Attention was evaluated via the Trail-Making Test part A, and executive functioning was assessed via Trail-Making Test part B (TMT-B). Spatial processing ability was assessed via the Clock Drawing Test and the CFT copy trial. Language processing ability was assessed via the Verbal Fluency Test. The total time required to complete all tests was approximately 60 minutes.
MR Imaging Data Acquisition
The resting-state fMRI data were acquired in a 3T Magnetom Trio scanner (Siemens, Erlangen, Germany). Foam padding and earplugs were used to reduce head motion and scanner noise. Subjects were instructed to keep their eyes closed, remain awake, and avoid specific thoughts during the scanning, which was later confirmed by using a questionnaire. A 6-minute whole-brain fMRI dataset based on blood oxygen level–dependent signals was acquired for each subject by using a gradient-echo EPI sequence (volume = 240, sections = 36, TR/TE = 2000/25 ms, section thickness = 4 mm, flip angle = 90°, FOV = 240 mm, acquisition matrix = 64 × 64). High-resolution (1-mm3) T1-weighted images were acquired by using a whole-brain 3D MPRAGE sequence (sections = 176, TR/TE = 1900/2.48 ms, section thickness = 1.0 mm, flip angle = 9°, FOV = 250 mm, acquisition matrix = 256 × 256). FLAIR images were also obtained (TR/TE = 8500/94 ms, sections = 20, section thickness = 5 mm, each with a voxel size of 1.3 × 0.9 × 5 mm3).
To assess small-vessel disease, we evaluated the white matter lesions and lacunar infarcts on FLAIR images.23 The brain was divided into 5 regions in each hemisphere, and the WM lesion score was determined separately for each region on a 4-point scale (from 0 to 3), resulting in final scores ranging from 0 to 30.23 Participants with a score of 3 in any region were considered to have severe small-vessel disease and were thus excluded. The final results indicated that none of the participants met the white matter lesion exclusion criteria.
Data Preprocessing
Functional MR imaging data were preprocessed by using Data Processing Assistant for Resting-State fMRI software (http://www.restfmri.net/forum/DPARSF) and SPM8 (http://www.fil.ion.ucl.ac.uk/spm/). After discarding the first 10 functional volumes, section-timing correction and realignment were subsequently performed (subjects with head motion of >2.0 mm of translation or >2.0° of rotation were excluded). Structural and functional images were then coregistered and normalized to the standard Montreal Neurological Institute space. Afterward, nuisance covariates, including 6 motion parameters, white matter, and CSF signals, were regressed out, followed by detrending and bandpass filtering (0.01–0.1 Hz) procedures. To minimize motion-induced artificial correlations, we cleaned functional images by applying a scrubbing procedure that removed images (frames) with >0.5-mm frame-wise displacement, along with the 2 frames immediately before and after the removed images.24 The number of scrubbed imaging volumes for each individual is summarized in On-line Fig 1. The mean frame-wise displacement of each subject was included as a motion covariate in the statistical analyses.
DC Analyses
DC maps can be represented as either weighted or binarized graphs, with the former focusing on the sum of weights from edges connecting to a node and the latter, on the number of the connected edges.13 Here, both graphs were computed to obtain more comprehensive information. The DC maps were generated by using Pearson correlations in Matlab (MathWorks, Natick, Massachusetts). Specifically, the time course of each voxel within a gray matter mask (obtained from the overlap of all subjects' segmented GM) was extracted and correlated with that of every other voxel within the mask to generate a correlation matrix. After thresholding each correlation at R > 0.25, we computed DC as either the sum of connections (binarized) or the sum of the weights of connections (weighted) for each voxel. The resulting voxelwise DC map was subsequently converted into a z score map by subtracting the global mean DC and dividing by the SD of the whole-brain DC.13 Finally, the DC maps were smoothed with a Gaussian kernel of 4 mm to obtain the individual DC maps for each subject.
Further analyses for DC maps were performed by using the Analysis of Functional Neuro Images software (AFNI; http://afni.nimh.nih.gov/afni).25 The smoothed individual DC maps of all subjects in each group were analyzed by using a 1-sample t test to identify the spatial distribution of the DC values in each group. The statistical threshold was set at P < .05, with a family-wise correction. Independent 2-sample t tests were also performed on the basis of the individual DC maps to examine the differences in DC between groups. Age, sex, years of education, and head motion (mean frame-wise displacement) were included as covariates. To further exclude the confounding effects of small-vessel disease, we also controlled for the WM lesion score and the existence of hypertension during the comparison. The Puncorrected value was set at .01, with a cluster size of 30 voxels (determined via Monte Carlo simulation) corresponding to a Pcorrected of .05.
Seed-Based FC Analyses
The identified brain regions with altered DC were chosen as the seeds to examine their FC changes. The time-series of each region was averaged and correlated with that of every other voxel within the GM mask. Correlation coefficients between the seed and every other voxel were then converted by using the Fisher r-to-z transform, yielding variates that were approximately normally distributed. One-sample t tests were performed on the individual z-transformed FC maps in each group to identify the spatial distribution of each brain circuit (P < .05 with family-wise error correction). Voxelwise group comparisons on each z-transformed FC map were then performed, which were confined to a mask obtained by combining the results of the within-group analyses in each group. Statistical significance was determined on the basis of Puncorrected < .01 and Pcorrected < .05. The same covariates used during the DC analyses were included.
Statistical Analyses
Clinical Data.
Statistical analyses were performed by using SPSS software (Version 18.0; IBM, Armonk, New York). Normal distributions were tested by using the Kolmogorov-Smirnov test. Group comparisons of clinical parameters were explored by using independent 2-sample t tests for normally distributed variables; the nonparametric Mann-Whitney U test, for asymmetrically distributed variables; and χ2 tests, for categoric variables. A P value ≤ .05 was considered statistically significant.
Relationship between FC and Clinical Variables.
The correlations between the FC of each seed-relevant network and the clinical variables, including neurocognitive performance (those tasks performed significantly worse by patients than by HCs) and T2DM-related parameters (HbA1c, FPG, and homeostasis model assessment of insulin resistance), were explored in a whole-brain linear regression model by using the 3dLME command in AFNI. The FC maps and clinical variables in both groups were entered into the models along with age, sex, education, head motion, and small-vessel disease parameters as covariates of no interest. To identify the regions where the FC was differentially correlated with clinical variables in patients versus HCs, we focused on the group × variable statistical interaction maps (Pcorrected < .05, Pvoxelwise < .01). Brain regions with significant interaction effects were considered important in contributing to T2DM-related cognitive impairment.
Results
Demographic and Clinical Parameters
All clinical parameters are summarized in Table 1. The 2 groups were matched in terms of age, sex, education, and their frame-wise displacement measurement. As expected, patients exhibited significantly higher FPG, HbA1c, and homeostasis model assessment of insulin resistance values than the HCs. No differences were observed in blood pressure, lipid levels, or degree of small-vessel disease. Patients performed significantly worse on CFT delay and TMT-B than HCs (Table 2), which mainly involve visual memory and executive functioning domains. Among the diabetes-related variables, disease duration was significantly correlated with the scores in 2 tasks after controlling for age (CFT copy, R = −0.45, P < .01; CFT delay, R = −0.40, P = .02), while the HbA1c level was associated with the CFT copy score (R = −0.35, P = .02).
Cognitive test results for the T2DM and control groupsa
DC Results
Due to the highly consistent results of the weighted and binarized measurements, the present findings are primarily based on the weighted maps.
The spatial distribution of the weighted DC maps is shown in Fig 1. In both groups, the DC in the posterior cingulate cortex, cuneus, visual cortex, medial prefrontal cortex, and insula was significantly higher than the global mean value. The binarized map shows a similar pattern (On-line Fig 2).

Spatial distribution of weighted DC maps in patients with T2DM and HCs (P < .05, family-wise error–corrected). In the weighted DC map, standardized DC in the posterior cingulate, visual cortex, medial prefrontal cortex, insula, and thalamus was significantly higher than the global mean values in both groups. Color scale denotes the z score. R indicates right; L, left.
Patients with T2DM exhibited decreased DC in the left lingual gyrus and increased DC in the right anterior insula and dorsal anterior cingulate cortex (dACC) (Fig 2). The results shown in the binarized DC map are highly consistent with the results in the weighted map (On-line Fig 3). Detailed information for the identified brain regions are summarized in Table 3 and the On-line Table.

Group differences of weighted DC maps between patients with T2DM and HCs (P < .05; AlphaSim-corrected; https://afni.nimh.nih.gov/pub/dist/doc/program_help/AlphaSim.html). In the weighted DC map, patients with T2DM showed significantly decreased value (cool color) in the left lingual gyrus and increased values (warm color) in the dACC and the right anterior insula. The color scale denotes the t-value.
Brain regions with significant differences in weighted DC maps between patients with T2DM and HCsa
Seed-Based FC Analyses
The FC pattern of each region (ie, dACC, right anterior insula, and left lingual gyrus) is shown in Fig 3. Specifically, the dACC was connected with the cingulate cortex, anterior insula, and sensorimotor cortex, while the right anterior insula was connected with the entire insula, dACC, and the adjacent frontal, temporal, and sensorimotor cortices. Meanwhile, the lingual gyrus was mainly connected with the visual cortex and the superior/middle temporal and sensorimotor cortices.

Spatial pattern of the network anchored in the regions with altered DC (P < .05, family-wise error–corrected). The dACC and right anterior insula (AI) exhibit similar connectivity patterns, which are largely included in the salience network. Specifically, the dACC is connected to the cingulate cortex, anterior insula, and sensorimotor cortex (first row). The AI is functionally connected to the entire insula, dACC, and adjacent frontal, temporal, and sensorimotor areas (second row). The lingual gyrus is mainly connected to the visual cortex and superior middle temporal and sensorimotor cortices (third row). The color scale denotes the t-value.
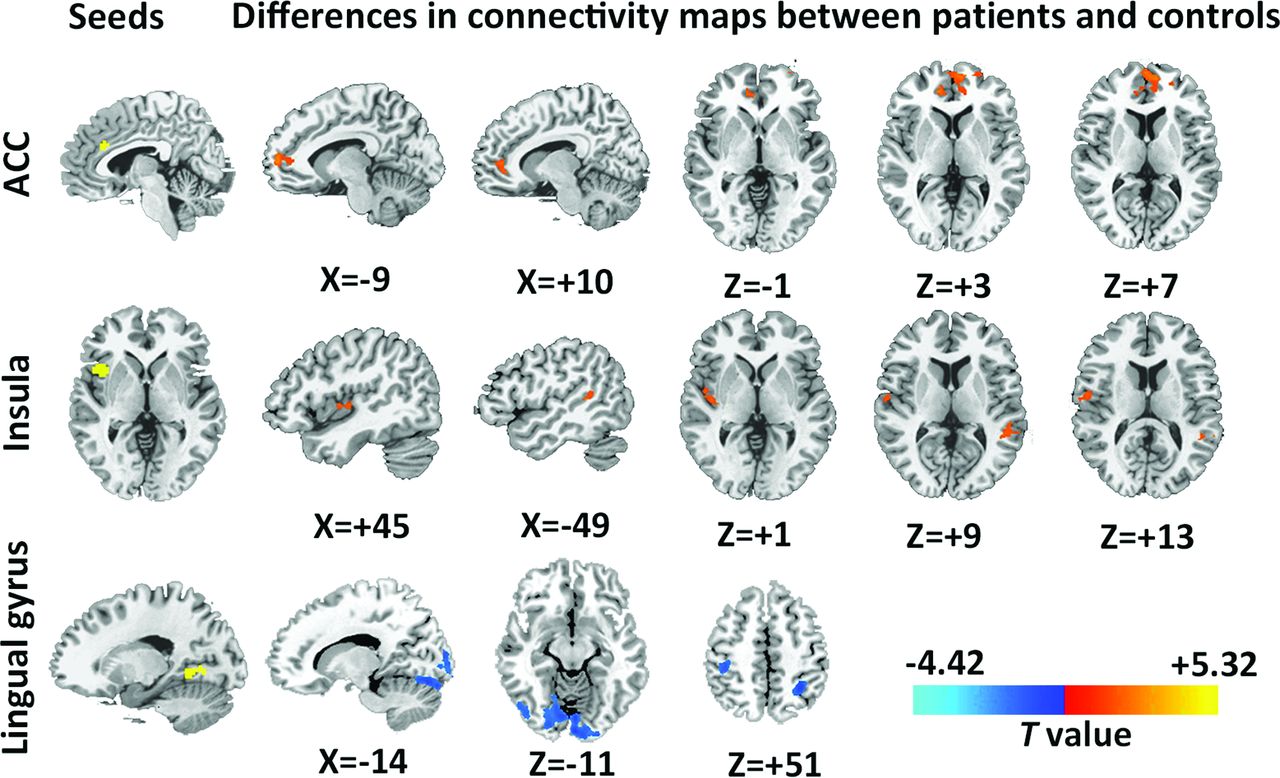
In the subjects with diabetes, the dACC showed stronger connectivity with the bilateral ventral dorsal anterior cingulate cortex/medial prefrontal cortex (Fig 4, first row), while the right anterior insula had increased interactions with the right posterior insula and left superior temporal gyrus (Fig 4, second row). In contrast, diffusely decreased connectivity was observed in the lingual gyrus–related visual network, especially in the higher order visual cortex and the sensory areas (Fig 4, third row).

Group differences of network connectivity based on the seed regions identified in the DC comparison (P < .05, AlphaSim-corrected). Regions with significant connectivity differences in networks anchored in hubs with altered DC (ie, dACC, anterior insula [AI], and lingual gyrus). In dACC-relevant network, increased connectivity was found in the medial prefrontal cortex (first row); in the AI-relevant network, increased connectivity was mainly located in the right insula and left superior temporal gyrus (second row). In the lingual gyrus–relevant network, decreased connectivity was diffusely distributed in the visual cortex and the sensory area and superior parietal lobule (third row). Coordinates are all in Montreal Neurological Institute space. The color bar denotes the t-value.
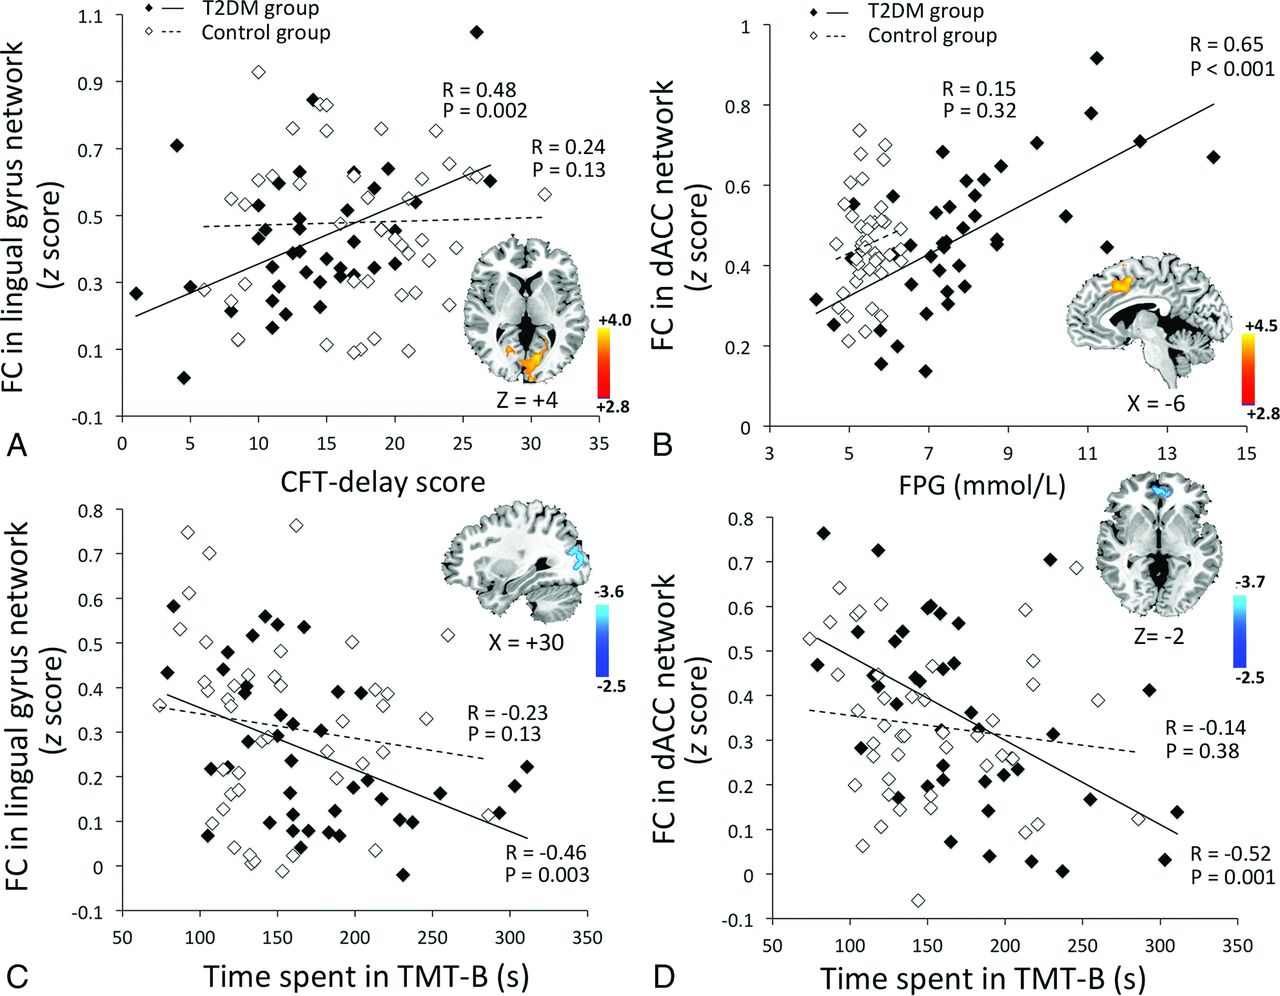
Voxelwise correlation analyses identified significant effects of the clinical variables on several brain regions in the T2DM group (Fig 5). The occipital connectivity was positively correlated with the CFT delay score (Fig 5A, R = 0.48, P = .002; group × performance interaction, P = .001) and negatively correlated with the time spent on the TMT-B (Fig 5C, R = −0.46, P = .003; group × performance interaction, P = .87). The hyperconnectivity of the dACC was correlated with higher FPG levels (Fig 5B, R = 0.65, P < .001; group × FPG interaction, P = .001) and better TMT-B performance (Fig 5D, R = −0.52, P = .001; group × performance interaction, P = .04). Due to the significant correlation between disease duration and neurocognitive performance, we further controlled for disease duration and reanalyzed the correlations. This reanalysis did not significantly affect our findings (data not shown). Similar effects were not detected in the HCs.

Voxelwise correlation between network connectivity (z score) and clinical variables. Correlations in the T2DM group are represented by black diamonds, while correlations in the control group are represented by white diamonds. The T2DM group: A, CFT-delay performance was positively correlated with the occipital connectivity in the lingual gyrus–relevant network (group × performance interaction, P = .001). B, FPG was positively correlated with the connectivity of dACC-relevant network, especially in the medial frontal cortex (group × FPG interaction, P = .001). C and D, Longer time spent on TMT-B was correlated with lower connectivity in the lingual gyrus–relevant network (C, group × performance interaction, P = .87) and lower connectivity in dACC-relevant network (D, group × performance interaction, P = .04). No such correlations were observed in the control group.
Discussion
Using graph theory–based analyses, the present study provides the initial evidence of altered global connectivity in the brains of patients with T2DM. Patients showed decreased DC in the occipital region and increased DC in the higher order cognitive control regions. Seed-based analytic approaches revealed that the brain circuits anchored in these regions were also affected, which was correlated with altered neurocognitive performance, suggesting that brain connectivity might be a potential imaging marker for T2DM-associated cognitive impairment.
Decreased DC and within-network connectivity were observed in the lingual gyrus. Consistent with these results, previous imaging studies on patients with T2DM have also reported occipital alterations. For example, the occipital lobe has been shown to have not only impaired cerebrovascular reactivity but also decreased overall volume.26,27 Studies on a similar diabetic population also reported a decrease in neural intensity and coherence around the lingual gyrus.28,29 The lingual gyrus and its associated occipital regions are linked to processing vision-related information and encoding visual memories.30 Given the positive correlations of occipital connectivity with visual memory and executive performance demonstrated in the current results, we suggest that decreased occipital connectivity might play an important role in the reduced performance in vision-dependent tasks in patients with T2DM. However, due to the small sample size and the lack of visual measurements, it is difficult to determine whether the hypoconnectivity is a neural alteration before or is a reflection of reduced visual input induced by potential diabetic retinopathy. Future studies are warranted to clarify the underlying neuropathology of these findings.
In the T2DM group, increased DC was observed in 2 critical brain hubs, the right anterior insula and dACC. Moreover, the connectivity of the networks anchored in these 2 regions was also elevated. The right anterior insula and dACC have strong reciprocal connectivity, forming the core of the salience network, which facilitates higher order cognitive control and behavioral adaption via the “bottom-up” signal detection and the “top-down” transmission of control signals.31 Although cognitive functions are often affected in patients with T2DM, the effect sizes are smaller in middle-aged adults compared with the effects in those older than 65 years.2 This finding is probably due to a greater brain reserve capacity in younger subjects, reflected by an increased neuronal interconnection.32 Moreover, longer diabetes duration in elder patients is often associated with a higher prevalence and severity of diabetic complications and comorbidities, which may further contribute to the worsening of cognitive function. Therefore, the increased connectivity in hub regions probably represents a compensatory mechanism in the younger diabetic population, in cases in which more neural resources were required to successfully accomplish relevant tasks. Our results showing a significant correlation between dACC hyperconnectivity and executive performance in the TMT-B task may also support such an assumption. However, whether this compensatory role ceases to be effective in elderly populations needs to be examined in future studies.
Previous fMRI studies primarily focused on the changes within the default mode network, attentional network, and thalamocortical connections have also identified differences in FC between patients with T2DM and HCs.6⇓–8,10,11 Unlike the seed-based analysis or independent component analysis, the graph theory–based approach adopted in the current study takes into account the entire functional connectome instead of relying on a priori seeds or blind source separation.13 The discrepancies in the methods used and the brain regions observed might be the cause of the differences in the findings between the current study and previous studies. In addition, our results suggest more prominent alterations in the occipital and salience network–related regions in relation to whole-brain functional interactions. Nevertheless, such results remain to be confirmed by future studies with a larger sample size.
As in many cross-sectional clinical studies, the current study has several limitations in addition to the relatively small sample size. First, the medications and the duration of diabetes of the included patients were quite variable, which could exert confounding effects on the DC measurement. Treatment-naive patients from a narrower disease-duration range should be recruited in future studies. Second, we did not adjust for visual acuity during the vision-dependent cognitive tasks. The inclusion of such measurements is crucial for understanding potential impairment of occipital connectivity, and this should be considered in future studies. Third, a questionnaire was used to confirm the state of the subjects during MR imaging. More objective and rigorous methods, such as visual fixation on a screen, should be performed to avoid such confounding effects. Finally, other FC measurements, such as dynamic and Granger causality connectivity, should be included to obtain more comprehensive information about the network changes in patients with T2DM.
Conclusions
This preliminary study suggests that in patients with T2DM, the connectivity density is altered in several brain regions. Decreased DC was primarily found in the occipital lobe, which was correlated with impaired visual memory and executive performance. Hyperconnectivity was found in key nodes (dACC and anterior insula) of the salience network, which is responsible for higher order cognitive control, and this was correlated with better executive performance. The current results suggest the importance of network connectivity as a potential imaging marker of cognitive decline in T2DM and may provide valuable insight into the neuropathologic process of T2DM-related brain alterations.
Acknowledgments
We thank Shaohua Wang and Dr Wenqing Xia, Department of Endocrinology, Affiliated Zhongda Hospital of Southeast University, for their assistance with the data collection.
Footnotes
Disclosures: Yihong Yang—RELATED: Other: Intramural Research Program of the National Institute on Drug Abuse, Comments: Yihong Yang is an employee of the Intramural Research Program of the National Institute on Drug Abuse, the National Institutes of Health.
This work was supported by grants from the Major State Basic Research Development Program of China (973 Program) (Nos. 2013CB733800, 2013CB733803), the Key Project of Jiangsu Province Natural Science Foundation of China (BK20130057), and the National Natural Science Foundation of China General Projects (Nos. 81230034, 81271739). S.-F.L., H.G., Y.-Z.H., X.L., and Y.Y. were supported by the Intramural Research Program of the National Institute on Drug Abuse, the National Institutes of Health.
Indicates open access to non-subscribers at www.ajnr.org
References
- Received September 24, 2015.
- Accepted after revision May 11, 2016.
- © 2016 by American Journal of Neuroradiology


