Advertisement

Main menu

  • Home
  • Content
    • Current Issue
    • Accepted Manuscripts
    • Article Preview
    • Past Issue Archive
    • Video Articles
    • AJNR Case Collection
    • Case of the Week Archive
    • Case of the Month Archive
    • Classic Case Archive
  • Special Collections
    • AJNR Awards
    • Low-Field MRI
    • Alzheimer Disease
    • ASNR Foundation Special Collection
    • Photon-Counting CT
    • View All
  • Multimedia
    • AJNR Podcasts
    • AJNR SCANtastic
    • Trainee Corner
    • MRI Safety Corner
    • Imaging Protocols
  • For Authors
    • Submit a Manuscript
    • Submit a Video Article
    • Submit an eLetter to the Editor/Response
    • Manuscript Submission Guidelines
    • Statistical Tips
    • Fast Publishing of Accepted Manuscripts
    • Graphical Abstract Preparation
    • Imaging Protocol Submission
    • Author Policies
  • About Us
    • About AJNR
    • Editorial Board
    • Editorial Board Alumni
  • More
    • Become a Reviewer/Academy of Reviewers
    • Subscribers
    • Permissions
    • Alerts
    • Feedback
    • Advertisers
    • ASNR Home

User menu

  • Alerts
  • Log in

Search

  • Advanced search
American Journal of Neuroradiology

American Journal of Neuroradiology

ASHNR American Society of Functional Neuroradiology ASHNR American Society of Pediatric Neuroradiology ASSR
  • Alerts
  • Log in

Advanced Search

  • Home
  • Content
    • Current Issue
    • Accepted Manuscripts
    • Article Preview
    • Past Issue Archive
    • Video Articles
    • AJNR Case Collection
    • Case of the Week Archive
    • Case of the Month Archive
    • Classic Case Archive
  • Special Collections
    • AJNR Awards
    • Low-Field MRI
    • Alzheimer Disease
    • ASNR Foundation Special Collection
    • Photon-Counting CT
    • View All
  • Multimedia
    • AJNR Podcasts
    • AJNR SCANtastic
    • Trainee Corner
    • MRI Safety Corner
    • Imaging Protocols
  • For Authors
    • Submit a Manuscript
    • Submit a Video Article
    • Submit an eLetter to the Editor/Response
    • Manuscript Submission Guidelines
    • Statistical Tips
    • Fast Publishing of Accepted Manuscripts
    • Graphical Abstract Preparation
    • Imaging Protocol Submission
    • Author Policies
  • About Us
    • About AJNR
    • Editorial Board
    • Editorial Board Alumni
  • More
    • Become a Reviewer/Academy of Reviewers
    • Subscribers
    • Permissions
    • Alerts
    • Feedback
    • Advertisers
    • ASNR Home
  • Follow AJNR on Twitter
  • Visit AJNR on Facebook
  • Follow AJNR on Instagram
  • Join AJNR on LinkedIn
  • RSS Feeds

AJNR Awards, New Junior Editors, and more. Read the latest AJNR updates

  • Getting new auth cookie, if you see this message a lot, tell someone!
  • Getting new auth cookie, if you see this message a lot, tell someone!
Research ArticleFUNCTIONAL
Open Access

Disrupted Brain Connectivity Patterns in Patients with Type 2 Diabetes

Y. Cui, S.-F. Li, H. Gu, Y.-Z. Hu, X. Liang, C.-Q. Lu, Y. Cai, C.-X. Wang, Y. Yang and G.-J. Teng
American Journal of Neuroradiology November 2016, 37 (11) 2115-2122; DOI: https://doi.org/10.3174/ajnr.A4858
Y. Cui
aFrom the Department of Radiology (Y.Cui, C.-Q.L., Y.Cai, C-X.W., G.-J.T.), Jiangsu Key Laboratory of Molecular and Functional Imaging, Zhongda Hospital, Medical School of Southeast University, Nanjing, China
bNeuroimaging Research Branch (Y.Cui, S.-F.L., H.G., Y.-Z.H, X.L., Y.Y.), National Institute on Drug Abuse, National Institutes of Health, Baltimore, Maryland.
  • Find this author on Google Scholar
  • Find this author on PubMed
  • Search for this author on this site
  • ORCID record for Y. Cui
S.-F. Li
bNeuroimaging Research Branch (Y.Cui, S.-F.L., H.G., Y.-Z.H, X.L., Y.Y.), National Institute on Drug Abuse, National Institutes of Health, Baltimore, Maryland.
  • Find this author on Google Scholar
  • Find this author on PubMed
  • Search for this author on this site
  • ORCID record for S.-F. Li
H. Gu
bNeuroimaging Research Branch (Y.Cui, S.-F.L., H.G., Y.-Z.H, X.L., Y.Y.), National Institute on Drug Abuse, National Institutes of Health, Baltimore, Maryland.
  • Find this author on Google Scholar
  • Find this author on PubMed
  • Search for this author on this site
  • ORCID record for H. Gu
Y.-Z. Hu
bNeuroimaging Research Branch (Y.Cui, S.-F.L., H.G., Y.-Z.H, X.L., Y.Y.), National Institute on Drug Abuse, National Institutes of Health, Baltimore, Maryland.
  • Find this author on Google Scholar
  • Find this author on PubMed
  • Search for this author on this site
  • ORCID record for Y.-Z. Hu
X. Liang
bNeuroimaging Research Branch (Y.Cui, S.-F.L., H.G., Y.-Z.H, X.L., Y.Y.), National Institute on Drug Abuse, National Institutes of Health, Baltimore, Maryland.
  • Find this author on Google Scholar
  • Find this author on PubMed
  • Search for this author on this site
  • ORCID record for X. Liang
C.-Q. Lu
aFrom the Department of Radiology (Y.Cui, C.-Q.L., Y.Cai, C-X.W., G.-J.T.), Jiangsu Key Laboratory of Molecular and Functional Imaging, Zhongda Hospital, Medical School of Southeast University, Nanjing, China
  • Find this author on Google Scholar
  • Find this author on PubMed
  • Search for this author on this site
  • ORCID record for C.-Q. Lu
Y. Cai
aFrom the Department of Radiology (Y.Cui, C.-Q.L., Y.Cai, C-X.W., G.-J.T.), Jiangsu Key Laboratory of Molecular and Functional Imaging, Zhongda Hospital, Medical School of Southeast University, Nanjing, China
  • Find this author on Google Scholar
  • Find this author on PubMed
  • Search for this author on this site
  • ORCID record for Y. Cai
C.-X. Wang
aFrom the Department of Radiology (Y.Cui, C.-Q.L., Y.Cai, C-X.W., G.-J.T.), Jiangsu Key Laboratory of Molecular and Functional Imaging, Zhongda Hospital, Medical School of Southeast University, Nanjing, China
  • Find this author on Google Scholar
  • Find this author on PubMed
  • Search for this author on this site
  • ORCID record for C.-X. Wang
Y. Yang
bNeuroimaging Research Branch (Y.Cui, S.-F.L., H.G., Y.-Z.H, X.L., Y.Y.), National Institute on Drug Abuse, National Institutes of Health, Baltimore, Maryland.
  • Find this author on Google Scholar
  • Find this author on PubMed
  • Search for this author on this site
  • ORCID record for Y. Yang
G.-J. Teng
aFrom the Department of Radiology (Y.Cui, C.-Q.L., Y.Cai, C-X.W., G.-J.T.), Jiangsu Key Laboratory of Molecular and Functional Imaging, Zhongda Hospital, Medical School of Southeast University, Nanjing, China
  • Find this author on Google Scholar
  • Find this author on PubMed
  • Search for this author on this site
  • ORCID record for G.-J. Teng
  • Article
  • Figures & Data
  • Supplemental
  • Info & Metrics
  • Responses
  • References
  • PDF
Loading

Article Figures & Data

Figures

  • Tables
  • Fig 1.
    • Download figure
    • Open in new tab
    • Download powerpoint
    Fig 1.

    Spatial distribution of weighted DC maps in patients with T2DM and HCs (P < .05, family-wise error–corrected). In the weighted DC map, standardized DC in the posterior cingulate, visual cortex, medial prefrontal cortex, insula, and thalamus was significantly higher than the global mean values in both groups. Color scale denotes the z score. R indicates right; L, left.

  • Fig 2.
    • Download figure
    • Open in new tab
    • Download powerpoint
    Fig 2.

    Group differences of weighted DC maps between patients with T2DM and HCs (P < .05; AlphaSim-corrected; https://afni.nimh.nih.gov/pub/dist/doc/program_help/AlphaSim.html). In the weighted DC map, patients with T2DM showed significantly decreased value (cool color) in the left lingual gyrus and increased values (warm color) in the dACC and the right anterior insula. The color scale denotes the t-value.

  • Fig 3.
    • Download figure
    • Open in new tab
    • Download powerpoint
    Fig 3.

    Spatial pattern of the network anchored in the regions with altered DC (P < .05, family-wise error–corrected). The dACC and right anterior insula (AI) exhibit similar connectivity patterns, which are largely included in the salience network. Specifically, the dACC is connected to the cingulate cortex, anterior insula, and sensorimotor cortex (first row). The AI is functionally connected to the entire insula, dACC, and adjacent frontal, temporal, and sensorimotor areas (second row). The lingual gyrus is mainly connected to the visual cortex and superior middle temporal and sensorimotor cortices (third row). The color scale denotes the t-value.
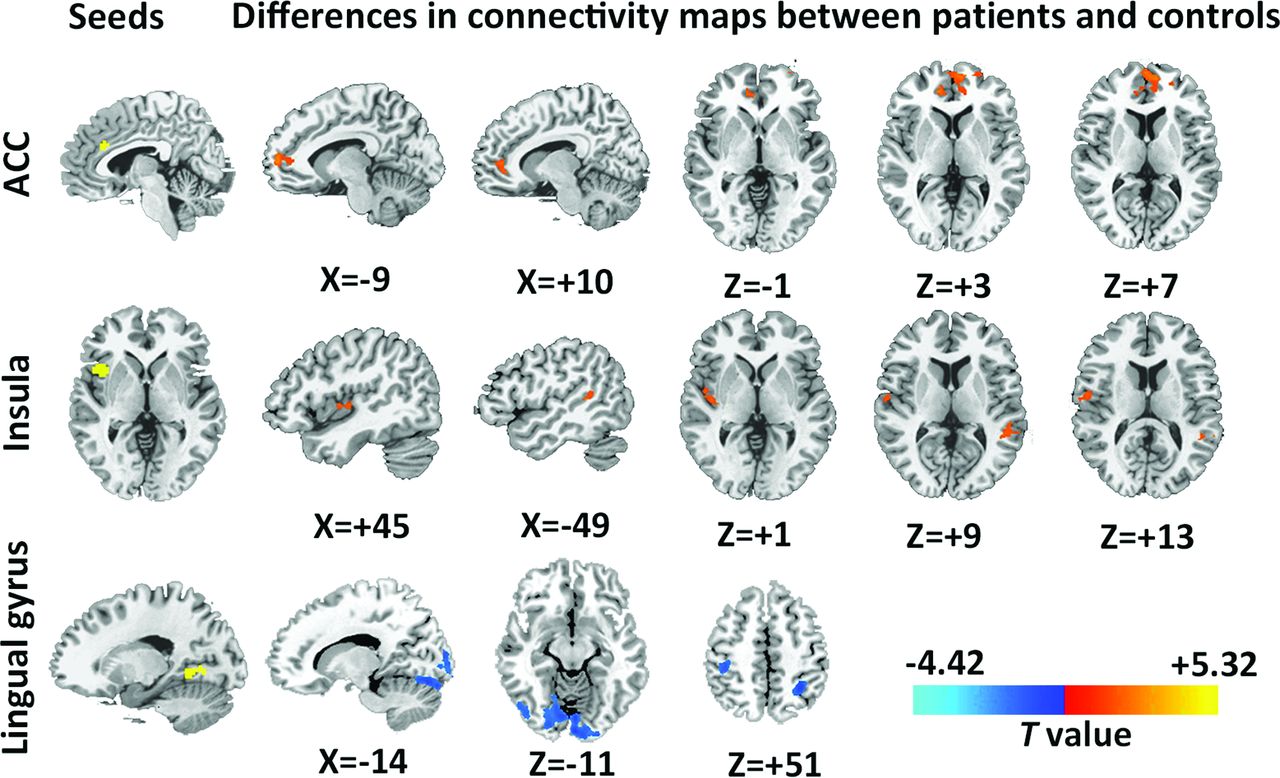
  • Fig 4.
    • Download figure
    • Open in new tab
    • Download powerpoint
    Fig 4.

    Group differences of network connectivity based on the seed regions identified in the DC comparison (P < .05, AlphaSim-corrected). Regions with significant connectivity differences in networks anchored in hubs with altered DC (ie, dACC, anterior insula [AI], and lingual gyrus). In dACC-relevant network, increased connectivity was found in the medial prefrontal cortex (first row); in the AI-relevant network, increased connectivity was mainly located in the right insula and left superior temporal gyrus (second row). In the lingual gyrus–relevant network, decreased connectivity was diffusely distributed in the visual cortex and the sensory area and superior parietal lobule (third row). Coordinates are all in Montreal Neurological Institute space. The color bar denotes the t-value.
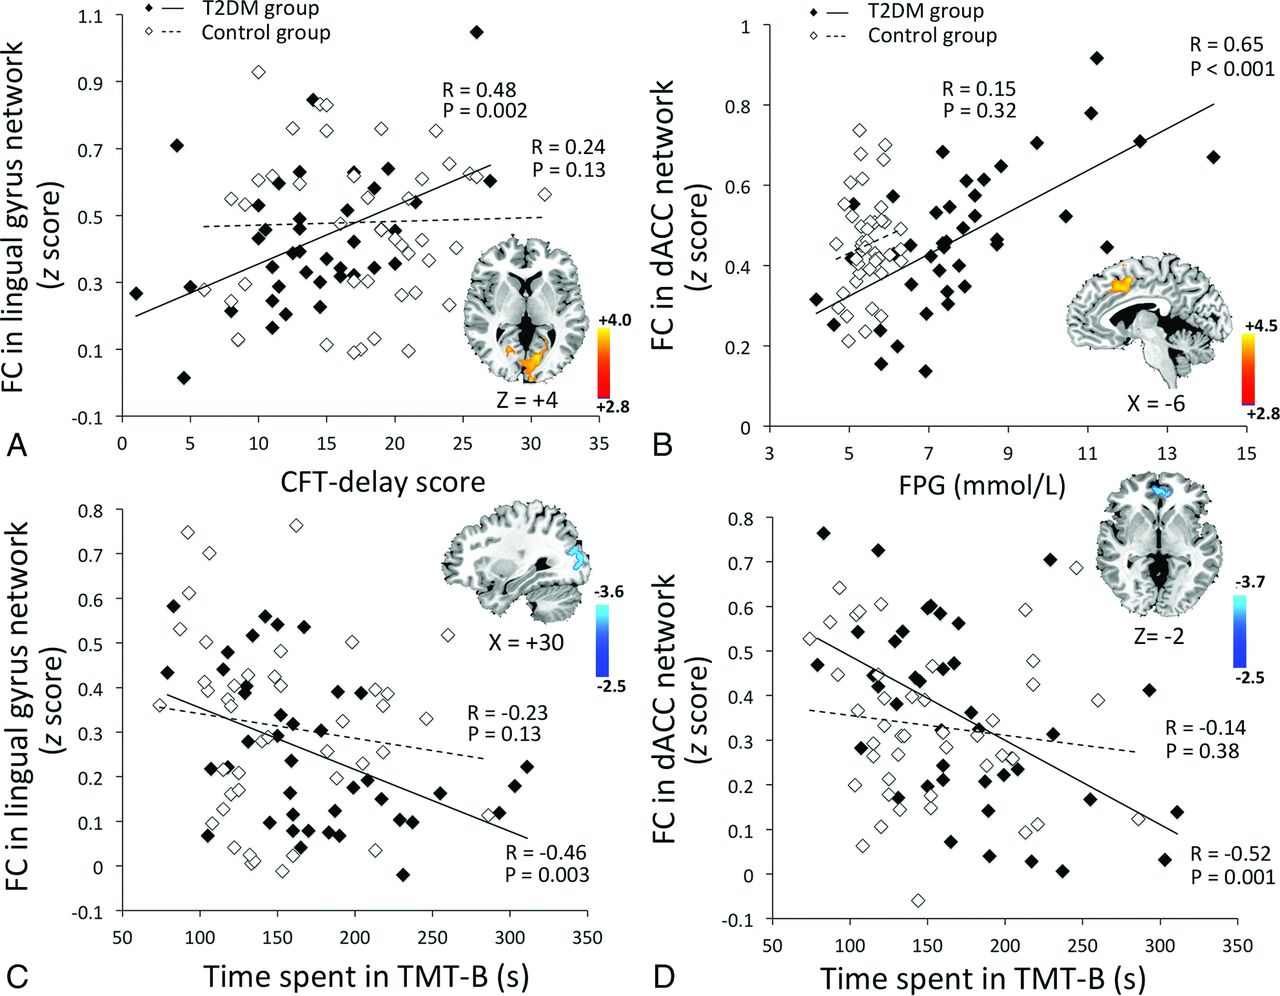
  • Fig 5.
    • Download figure
    • Open in new tab
    • Download powerpoint
    Fig 5.

    Voxelwise correlation between network connectivity (z score) and clinical variables. Correlations in the T2DM group are represented by black diamonds, while correlations in the control group are represented by white diamonds. The T2DM group: A, CFT-delay performance was positively correlated with the occipital connectivity in the lingual gyrus–relevant network (group × performance interaction, P = .001). B, FPG was positively correlated with the connectivity of dACC-relevant network, especially in the medial frontal cortex (group × FPG interaction, P = .001). C and D, Longer time spent on TMT-B was correlated with lower connectivity in the lingual gyrus–relevant network (C, group × performance interaction, P = .87) and lower connectivity in dACC-relevant network (D, group × performance interaction, P = .04). No such correlations were observed in the control group.

Tables

  • Figures
    • View popup
    Table 1:

    Demographics and clinical characteristics for T2DM and control groupsa

    MeasuresT2DM (n = 40)Control (n = 43)P Value
    Age (yr)60.5 ± 6.957.6 ± 6.6.08
    Sex (male/female)a24:2116:30.09
    Education (yr)10.0 ± 3.410.2 ± 2.3.46
    Head motion (FD) (mm)0.09 ± 0.070.08 ± 0.05.35
    Diabetes duration (yr)8.9 ± 5.0––
    Insulin treatment (No.) (%)8 (20)––
    HbA1c (%) (mmol/mol)7.8 ± 1.6 (62 ± 17.5)5.6 ± 0.3 (37 ± 3.3)<.001b
    FPG (mmol/L)7.8 ± 2.15.5 ± 0.4<.001b
    HOMA-IR3.1 ± 1.92.4 ± 1.1.02b
    BMI (kg/m2)24.4 ± 2.723.8 ± 2.7.22
    Systolic BP (mm Hg)136.6 ± 14.8132.7 ± 14.8.18
    Diastolic BP (mm Hg)86.0 ± 11.186.6 ± 11.2.81
    Hypertension (No.) (%)c21 (53)12 (28)
    Antihypertensive treatment (No.) (%)c17 (43)8 (19)
    Total cholesterol (mmol/L)5.5 ± 1.25.3 ± 0.9.46
    Triglyceride (mmol/L)1.5 ± 0.81.4 ± 0.8.69
    HDL cholesterol (mmol/L)1.4 ± 0.31.3 ± 0.7.57
    LDL cholesterol (mmol/L)3.3 ± 0.83.1 ± 0.6.30
    White matter lesions (range)0–60–7.26
    Lacunar infarcts (No.) (%)a95.11
    • Note:—FD indicates frame-wise displacement; HOMA-IR, homeostasis model assessment of insulin resistance; BP, blood pressure; BMI, body mass index; LDL, low-density lipoprotein; HDL, high-density lipoprotein.

    • ↵a Data are mean and number or range.

    • ↵b P value < .05.

    • ↵c Statistical analyses were performed by χ2 tests.

    • View popup
    Table 2:

    Cognitive test results for the T2DM and control groupsa

    MeasuresT2DM (n = 40)Control (n = 43)P Value
    General cognitive status
        MMSE28.3 ± 1.228.7 ± 1.2.26
    Episodic memory
        AVLT5.9 ± 1.36.3 ± 1.8.11
        AVLT, delay5.8 ± 2.36.3 ± 2.1.31
        CFT, delay13.9 ± 5.817.5 ± 5.8<.01b
    Working memory
        DST (forward)6.8 ± 1.37.3 ± 1.5.11
        DST (backward)4.1 ± 1.04.5 ± 1.3.16
    Attention
        TMT, part A64.5 ± 19.063.3 ± 14.8.76
    Executive functioning
        TMT, part B182.2 ± 62.8152.0 ± 50.6.02b
    Spatial processing
        CFT, copy34.3 ± 1.834.8 ± 1.5.16
        CDT3.3 ± 0.63.5 ± 0.6.07
    Language processing
        VFT16.5 ± 3.617.6 ± 3.0.52
    • Note:—MMSE indicates Mini-Mental State Examination; AVLT, Auditory Verbal Learning Test; DST, Digit Span Test; CDT, Clock Drawing Test; VFT, Verbal Fluency Test.

    • ↵a Data are represented as means.

    • ↵b P value < .05.

    • View popup
    Table 3:

    Brain regions with significant differences in weighted DC maps between patients with T2DM and HCsa

    Brain RegionsMNIVoxelsPeak t-Value
    XYZ
    RAI+42+15+051+4.30
    dACC+6+30+2431+4.03
    L lingual gyrus−15−51−337−3.51
    • Note:—MNI indicates Montreal Neurological Institute; RAI, right anterior insula; L, left.

    • ↵a Comparisons were performed at P < .05, corrected by AlphaSim multiple comparisons. X, y, and z are coordinates of primary peak locations in the MNI space. Positive t values are T2DM > control subjects. Negative t values are T2DM < control subjects.

PreviousNext
Back to top

In this issue

American Journal of Neuroradiology: 37 (11)
American Journal of Neuroradiology
Vol. 37, Issue 11
1 Nov 2016
  • Table of Contents
  • Index by author
  • Complete Issue (PDF)
Advertisement
Print
Download PDF
Email Article

Thank you for your interest in spreading the word on American Journal of Neuroradiology.

NOTE: We only request your email address so that the person you are recommending the page to knows that you wanted them to see it, and that it is not junk mail. We do not capture any email address.

Enter multiple addresses on separate lines or separate them with commas.
Disrupted Brain Connectivity Patterns in Patients with Type 2 Diabetes
(Your Name) has sent you a message from American Journal of Neuroradiology
(Your Name) thought you would like to see the American Journal of Neuroradiology web site.
CAPTCHA
This question is for testing whether or not you are a human visitor and to prevent automated spam submissions.
Cite this article
Y. Cui, S.-F. Li, H. Gu, Y.-Z. Hu, X. Liang, C.-Q. Lu, Y. Cai, C.-X. Wang, Y. Yang, G.-J. Teng
Disrupted Brain Connectivity Patterns in Patients with Type 2 Diabetes
American Journal of Neuroradiology Nov 2016, 37 (11) 2115-2122; DOI: 10.3174/ajnr.A4858

Citation Manager Formats

  • BibTeX
  • Bookends
  • EasyBib
  • EndNote (tagged)
  • EndNote 8 (xml)
  • Medlars
  • Mendeley
  • Papers
  • RefWorks Tagged
  • Ref Manager
  • RIS
  • Zotero
0 Responses
Respond to this article
Share
Bookmark this article
Disrupted Brain Connectivity Patterns in Patients with Type 2 Diabetes
Y. Cui, S.-F. Li, H. Gu, Y.-Z. Hu, X. Liang, C.-Q. Lu, Y. Cai, C.-X. Wang, Y. Yang, G.-J. Teng
American Journal of Neuroradiology Nov 2016, 37 (11) 2115-2122; DOI: 10.3174/ajnr.A4858
del.icio.us logo Twitter logo Facebook logo Mendeley logo
  • Tweet Widget
  • Facebook Like
  • Google Plus One
Purchase

Jump to section

  • Article
    • Abstract
    • ABBREVIATIONS:
    • Materials and Methods
    • Results
    • Discussion
    • Conclusions
    • Acknowledgments
    • Footnotes
    • References
  • Figures & Data
  • Supplemental
  • Info & Metrics
  • Responses
  • References
  • PDF

Related Articles

  • PubMed
  • Google Scholar

Cited By...

  • The Interaction Effects of Sex, Age, APOE and Common Health Risk Factors on Human Brain Functions
  • Altered Odor-Induced Brain Activity as an Early Manifestation of Cognitive Decline in Patients With Type 2 Diabetes
  • Crossref
  • Google Scholar

This article has not yet been cited by articles in journals that are participating in Crossref Cited-by Linking.

More in this TOC Section

  • Kurtosis and Epileptogenic Tubers: A Pilot Study
  • Glutaric Aciduria Type 1: DK vs. Conventional MRI
  • WM Neuroaxonal Loss in Type 1 Diabetes
Show more Functional

Similar Articles

Advertisement

Indexed Content

  • Current Issue
  • Accepted Manuscripts
  • Article Preview
  • Past Issues
  • Editorials
  • Editor's Choice
  • Fellows' Journal Club
  • Letters to the Editor
  • Video Articles

Cases

  • Case Collection
  • Archive - Case of the Week
  • Archive - Case of the Month
  • Archive - Classic Case

More from AJNR

  • Trainee Corner
  • Imaging Protocols
  • MRI Safety Corner
  • Book Reviews

Multimedia

  • AJNR Podcasts
  • AJNR Scantastics

Resources

  • Turnaround Time
  • Submit a Manuscript
  • Submit a Video Article
  • Submit an eLetter to the Editor/Response
  • Manuscript Submission Guidelines
  • Statistical Tips
  • Fast Publishing of Accepted Manuscripts
  • Graphical Abstract Preparation
  • Imaging Protocol Submission
  • Evidence-Based Medicine Level Guide
  • Publishing Checklists
  • Author Policies
  • Become a Reviewer/Academy of Reviewers
  • News and Updates

About Us

  • About AJNR
  • Editorial Board
  • Editorial Board Alumni
  • Alerts
  • Permissions
  • Not an AJNR Subscriber? Join Now
  • Advertise with Us
  • Librarian Resources
  • Feedback
  • Terms and Conditions
  • AJNR Editorial Board Alumni

American Society of Neuroradiology

  • Not an ASNR Member? Join Now

© 2025 by the American Society of Neuroradiology All rights, including for text and data mining, AI training, and similar technologies, are reserved.
Print ISSN: 0195-6108 Online ISSN: 1936-959X

Powered by HighWire