Advertisement

Main menu

  • Home
  • Content
    • Current Issue
    • Accepted Manuscripts
    • Article Preview
    • Past Issue Archive
    • AJNR Case Collection
    • Case of the Week Archive
    • Classic Case Archive
    • Case of the Month Archive
  • Special Collections
    • Spinal CSF Leak Articles (Jan 2020-June 2024)
    • 2024 AJNR Journal Awards
    • Most Impactful AJNR Articles
  • Multimedia
    • AJNR Podcast
    • AJNR Scantastics
    • Video Articles
  • For Authors
    • Submit a Manuscript
    • Author Policies
    • Fast publishing of Accepted Manuscripts
    • Graphical Abstract Preparation
    • Manuscript Submission Guidelines
    • Imaging Protocol Submission
    • Submit a Case for the Case Collection
  • About Us
    • About AJNR
    • Editorial Board
  • More
    • Become a Reviewer/Academy of Reviewers
    • Subscribers
    • Permissions
    • Alerts
    • Feedback
    • Advertisers
    • ASNR Home
  • Other Publications
    • ajnr

User menu

  • Alerts
  • Log in

Search

  • Advanced search
American Journal of Neuroradiology

American Journal of Neuroradiology

ASHNR American Society of Functional Neuroradiology ASHNR American Society of Pediatric Neuroradiology ASSR
  • Alerts
  • Log in

Advanced Search

  • Home
  • Content
    • Current Issue
    • Accepted Manuscripts
    • Article Preview
    • Past Issue Archive
    • AJNR Case Collection
    • Case of the Week Archive
    • Classic Case Archive
    • Case of the Month Archive
  • Special Collections
    • Spinal CSF Leak Articles (Jan 2020-June 2024)
    • 2024 AJNR Journal Awards
    • Most Impactful AJNR Articles
  • Multimedia
    • AJNR Podcast
    • AJNR Scantastics
    • Video Articles
  • For Authors
    • Submit a Manuscript
    • Author Policies
    • Fast publishing of Accepted Manuscripts
    • Graphical Abstract Preparation
    • Manuscript Submission Guidelines
    • Imaging Protocol Submission
    • Submit a Case for the Case Collection
  • About Us
    • About AJNR
    • Editorial Board
  • More
    • Become a Reviewer/Academy of Reviewers
    • Subscribers
    • Permissions
    • Alerts
    • Feedback
    • Advertisers
    • ASNR Home
  • Follow AJNR on Twitter
  • Visit AJNR on Facebook
  • Follow AJNR on Instagram
  • Join AJNR on LinkedIn
  • RSS Feeds

Welcome to the new AJNR, Updated Hall of Fame, and more. Read the full announcements.


AJNR is seeking candidates for the position of Associate Section Editor, AJNR Case Collection. Read the full announcement.


Review ArticleAdult Brain
Open Access

Sodium MR Neuroimaging

A. Hagiwara, M. Bydder, T.C. Oughourlian, J. Yao, N. Salamon, R. Jahan, J.P. Villablanca, D.R. Enzmann and B.M. Ellingson
American Journal of Neuroradiology November 2021, 42 (11) 1920-1926; DOI: https://doi.org/10.3174/ajnr.A7261
A. Hagiwara
aFrom the UCLA Brain Tumor Imaging Laboratory (A.H., M.B., T.C.O., J.Y., B.M.E.), Center for Computer Vision and Imaging Biomarkers
cDepartment of Radiological Sciences (A.H., M.B., J.Y., N.S., R.J., J.P.V., D.R.E., B.M.E.)
  • Find this author on Google Scholar
  • Find this author on PubMed
  • Search for this author on this site
  • ORCID record for A. Hagiwara
M. Bydder
aFrom the UCLA Brain Tumor Imaging Laboratory (A.H., M.B., T.C.O., J.Y., B.M.E.), Center for Computer Vision and Imaging Biomarkers
cDepartment of Radiological Sciences (A.H., M.B., J.Y., N.S., R.J., J.P.V., D.R.E., B.M.E.)
  • Find this author on Google Scholar
  • Find this author on PubMed
  • Search for this author on this site
  • ORCID record for M. Bydder
T.C. Oughourlian
aFrom the UCLA Brain Tumor Imaging Laboratory (A.H., M.B., T.C.O., J.Y., B.M.E.), Center for Computer Vision and Imaging Biomarkers
dNeuroscience Interdepartmental Program (T.C.O., B.M.E.)
  • Find this author on Google Scholar
  • Find this author on PubMed
  • Search for this author on this site
  • ORCID record for T.C. Oughourlian
J. Yao
aFrom the UCLA Brain Tumor Imaging Laboratory (A.H., M.B., T.C.O., J.Y., B.M.E.), Center for Computer Vision and Imaging Biomarkers
bDepartment of Bioengineering (J.Y., B.M.E.), Henry Samueli School of Engineering and Applied Science, University of California Los Angeles, Los Angeles, California
cDepartment of Radiological Sciences (A.H., M.B., J.Y., N.S., R.J., J.P.V., D.R.E., B.M.E.)
  • Find this author on Google Scholar
  • Find this author on PubMed
  • Search for this author on this site
  • ORCID record for J. Yao
N. Salamon
cDepartment of Radiological Sciences (A.H., M.B., J.Y., N.S., R.J., J.P.V., D.R.E., B.M.E.)
  • Find this author on Google Scholar
  • Find this author on PubMed
  • Search for this author on this site
  • ORCID record for N. Salamon
R. Jahan
cDepartment of Radiological Sciences (A.H., M.B., J.Y., N.S., R.J., J.P.V., D.R.E., B.M.E.)
  • Find this author on Google Scholar
  • Find this author on PubMed
  • Search for this author on this site
  • ORCID record for R. Jahan
J.P. Villablanca
cDepartment of Radiological Sciences (A.H., M.B., J.Y., N.S., R.J., J.P.V., D.R.E., B.M.E.)
  • Find this author on Google Scholar
  • Find this author on PubMed
  • Search for this author on this site
  • ORCID record for J.P. Villablanca
D.R. Enzmann
cDepartment of Radiological Sciences (A.H., M.B., J.Y., N.S., R.J., J.P.V., D.R.E., B.M.E.)
  • Find this author on Google Scholar
  • Find this author on PubMed
  • Search for this author on this site
  • ORCID record for D.R. Enzmann
B.M. Ellingson
aFrom the UCLA Brain Tumor Imaging Laboratory (A.H., M.B., T.C.O., J.Y., B.M.E.), Center for Computer Vision and Imaging Biomarkers
bDepartment of Bioengineering (J.Y., B.M.E.), Henry Samueli School of Engineering and Applied Science, University of California Los Angeles, Los Angeles, California
cDepartment of Radiological Sciences (A.H., M.B., J.Y., N.S., R.J., J.P.V., D.R.E., B.M.E.)
dNeuroscience Interdepartmental Program (T.C.O., B.M.E.)
eDepartment of Psychiatry and Biobehavioral Sciences (B.M.E.), David Geffen School of Medicine, University of California, Los Angeles, Los Angeles, California
  • Find this author on Google Scholar
  • Find this author on PubMed
  • Search for this author on this site
  • ORCID record for B.M. Ellingson
  • Article
  • Figures & Data
  • Info & Metrics
  • Responses
  • References
  • PDF
Loading

Abstract

SUMMARY: Sodium MR imaging has the potential to complement routine proton MR imaging examinations with the goal of improving diagnosis, disease characterization, and clinical monitoring in neurologic diseases. In the past, the utility and exploration of sodium MR imaging as a valuable clinical tool have been limited due to the extremely low MR signal, but with recent improvements in imaging techniques and hardware, sodium MR imaging is on the verge of becoming clinically realistic for conditions that include brain tumors, ischemic stroke, and epilepsy. In this review, we briefly describe the fundamental physics of sodium MR imaging tailored to the neuroradiologist, focusing on the basics necessary to understand factors that play into making sodium MR imaging feasible for clinical settings and describing current controversies in the field. We will also discuss the current state of the field and the potential future clinical uses of sodium MR imaging in the diagnosis, phenotyping, and therapeutic monitoring in neurologic diseases.

ABBREVIATIONS:

ESC
extracellular sodium concentration
IDH
isocitrate dehydrogenase
ISC
intracellular sodium concentration
NHE1
Na+/H+ exchanger isoform 1
TSC
total sodium concentration

Routine clinical MR imaging is performed exclusively by using hydrogen nuclei (ie, protons, H+) because it is the most abundant element in the human body in the form of water. However, other nuclei are also detectable with MR imaging and may provide complementary physiologic information to conventional proton MR imaging. Referred to collectively as “X-nuclei,” elements including sodium (23Na), potassium (35K), chloride (35Cl), and phosphorus (31P) all have detectable magnetic moments and all play critical roles in the biochemistry of living tissues.

Sodium is the second most abundant element in the body detectable on MR imaging. Sodium homeostasis is crucial for life because it is a major determinant of body fluid osmolality, and sodium sensing is performed in the brain by specialized sodium channels within the circumventricular organs to maintain a range of 135–145 mM.1 Sodium also plays a crucial role in the propagation of neural signals in and between neurons,2,3 and disruption in sodium homeostasis as well as structural and metabolic integrity has been identified in a variety of neurologic disorders including brain tumors,4 stroke,5 and epilepsy.6 Hence, sodium MR imaging has remarkable potential for use in diagnosis, characterization, and treatment monitoring in neurologic diseases.

The fundamental limitation to translational use of sodium MR imaging for clinical care is the low inherent MR signal. The MR imaging signal is approximately 10,000 times lower than that of protons, which is due to a combination of the following: 1) a concentration of about 0.055% of that of water protons; 2) a gyromagnetic ratio (γ, relates the main magnetic field strength, B0, to the resonance frequency) of about 26.5% of that of the proton, thus a lower energy (ΔE = γℏB0) and lower inherent bulk magnetization; and 3) a nuclear spin of 3/2, leading to electric quadrupolar interactions between the nucleus and its environment resulting in faster T2* decay. Overcoming these issues and achieving adequate MR signal levels necessitates acquisition schemes with low spatial resolution, short TE, multiple measurements, and long scan times. Researchers have put considerable effort into optimizing these various factors and taking advantage of both the acquisition algorithm and hardware improvements. In this review, we briefly describe the fundamental physics of sodium MR imaging tailored to the neuroradiologist, focusing on the basics necessary to understand factors that are involved in making sodium MR imaging feasible for clinical settings and describing current controversies in the field, including the measurement of intracellular sodium concentration. We will also discuss the current state of the field and the potential future clinical uses of sodium MR imaging in the diagnosis, phenotyping, and therapeutic monitoring in neurologic diseases.

Sodium MR Imaging Physics and Acquisition

In practice, MR imaging of sodium ions is essentially the same as imaging protons, but with lower SNR and shorter (and more complex) T2 relaxation characteristics. Due to the inherent nuclear spin of 3/2, the sodium ion exhibits electric quadrupolar interactions between the nucleus and its environment,7,8 leading to what appears to be a biexponential T2 decay in many biologic tissues. The short T2 species appears to occur most often in viscous liquids or semisolid tissues, where there is a continuum of electric field gradients (depending on the orientation of the sodium ion and the position of an anion) that produces a broad range of energy levels and gives rise to short T2 relaxation. A longer T2 component is observed from the energy levels unperturbed by the electric field gradients,7 such as those in CSF and other nonviscous liquids because the motion of the ions causes electric field gradients to average to zero over the measurement time scale, resulting in a single, longer T2 relaxation. This observation has been replicated in the human brain, where parenchyma, including both white and gray matter, exhibits a characteristic biexponential T2 decay, while the nonviscous CSF displays monoexponential T2 relaxation.9

Most measurements used in clinical sodium MR imaging focus on estimation of the total sodium concentration (TSC) or the volume-weighted average of the intra- and extracellular sodium concentrations (ISC and ESC, respectively). Notably, ISC and ESC do not correspond to short and long sodium T2 relaxation (explained later in this section). Because ESC is stable at around 140 mM, TSC is mainly affected by changes in ISC and alterations in the volume fractions between the intra- and extracellular space. TSC in the brain was reported to range from 30 to 56 mM10⇓-12 and remain constant throughout adulthood in cognitively healthy individuals, and its regional variation in the brain was reported to be minimal.12 Sodium concentration in the CSF has been known to show circadian fluctuation;13 however, whether TSC in the brain tissue also shows circadian fluctuation and whether the degree of fluctuation is different between normal and pathologic brain tissues are unknown. Remarkable effort has been made to measure ISC during the past decades in animal models to elucidate cellular homeostasis, energetic state, and functionality of sodium pumps; however, these measurements involve the use of highly toxic extracellular paramagnetic “frequency shift reagents” that are trapped within the extracellular space and shift the resonance frequency of extracellular sodium, resulting in isolation of purely intracellular sodium ions.14,15 Unfortunately, due to their toxicity and the fact they do not cross the blood-brain barrier, shift reagents for sodium MR imaging are not used in humans.

Two major physics approaches to measure the ISC in humans that have been explored include the use of inversion recovery16⇓⇓-19 and multiple quantum filtering20⇓-22 techniques. Similar to FLAIR, the inversion recovery approach assumes that a simple inversion pulse can suppress the sodium signals free from macromolecules; hence, the sodium signal in the extracellular space is also presumed to be suppressed. However, there is evidence that the T1 relaxation times of intra- and extracellular sodium are very similar,23⇓⇓⇓⇓-28 and there is little reason to assume that the T1 of the sodium within the extracellular compartment is more similar to that in CSF than in the intracellular compartment. Indeed, extracellular fluid in brain tissue is largely different from CSF in composition.29

Multiple quantum filtering is a relatively sophisticated approach that works on the premise that the slow-moving sodium, presumably in the intracellular space, can be selectively detected on the basis of the underlying biexponential T2 relaxation of sodium.30 However, molecular interactions that result in equivalently small T2 values in both intra- and extracellular compartments are expected to result in similar multiple quantum coherences.27 Indeed, previous experiments have shown a contribution of the extracellular sodium to the multiple quantum coherences detected by multiple quantum-filtering sodium MR imaging, and the degree of contamination is largely unexplored.31⇓-33 Therefore, direct measurement of the ISC solely using sodium MR imaging physics without the use of exogenous contrast agents is not yet plausible, and such claims in previous literature using the relaxation behavior of sodium should be cautiously interpreted. Furthermore, the exchange rate of sodium between intra- and extracellular space, which might affect the measurement of the ISC, has not been considered in previous studies. Future studies aimed at using multiparametric input from proton diffusion MR imaging and/or PET may be useful for using estimates of cell density34 to disentangle the ISC from the TSC measured by sodium MR imaging, but as of now, TSC is the most reliable measurement parameter for routine sodium MR imaging examinations.

The primary challenge for clinical sodium MR imaging is the very short T2, meaning that most of the sodium MR imaging signal is lost within a few milliseconds. Hence, imaging with a very short, ultrashort, or zero TE (ie, TE of <1 ms) is almost mandatory for any sodium MR imaging application. High quantification accuracy of the sodium concentration with ultrashort TE imaging has been reported.10,35 To reduce the duration of signal readout while maintaining sufficient SNR, non-Cartesian sequences (eg, radial or spiral trajectories) are preferred.36,37 For example, Ridley et al38 used a 3D radial projection for whole-brain imaging, with 3-mm isotropic resolution on a 3T clinical scanner in 34 minutes. On the other hand, Thulborn et al39 showed that a twisted radial k-space imaging trajectory could be used for whole-brain coverage with 5-mm isotropic resolution (44 slices) on a 3T clinical scanner in approximately 8 minutes, which was sufficient for brain tumor imaging applications.

In addition to creative k-space trajectories, advancements in hardware have also made sodium MR imaging more clinically realizable. The use of high- and ultra-high-field strength scanners, for example, proportionally increases the SNR, making commercial 7T MR imaging scanners feasible for faster or higher resolution sodium imaging.11 Of note, higher resolution, especially with 3D imaging, helps reduce partial volume effects. In addition to the use of high-field-strength scanners, receiver coil architecture is also of great importance because the design of this coil predetermines the maximum attainable SNR. Because proton MR imaging is often performed concurrently with sodium imaging, the same physical coil housing (ie, “dual tuned” coils) is desired. Dual-tuned designs of different Larmor frequencies come with unique challenges, however, such as coupling between the sodium and proton coils.40 This issue could be addressed by using 2-coil geometries that are intrinsically decoupled, dual-tuning a single coil, or strategies to actively decouple the 2 coils.40 Use of array coils is an attractive approach in sodium imaging to further increase the SNR and reduce scan time by using parallel imaging strategies.41 For example, Lee et al42 demonstrated up to a 400% increases in the SNR using a 4-channel coil >20 years ago. To date, the highest number of channels reported for a head sodium coil is 32,28 while 20- to 30-channel coils are commercialized and available through third-party coil vendors. However, despite remarkable progress, array coils are still rarely used in sodium imaging because of hardware and software limitations and additional costs.41 For using array coils in sodium MR imaging, the receivers should be capable of handling the frequencies relevant to sodium acquired with analog-to-digital converters and having processing engines capable of sorting and combining the signals from each coil properly. Most commercial scanners have offered only a single broadband X-nuclei receiver channel, limiting the use of array coils.

Neurologic Applications

Brain Tumors.

In brain tumors, sodium MR imaging has the potential to reveal molecular information related to cell viability, proliferation, migration, invasion, and immunogenicity43⇓-45 and may enable us to reveal molecular responses to treatment before morphologic changes can be observed. TSC is reportedly elevated in brain tumors both in humans19,22,39,46⇓-48 and animals,49,50 a feature that may be due to the ISC, the volume of the extracellular space, or both, considering that the ESC remains relatively constant and much higher than the ISC as long as there is moderate tissue perfusion.51 Increases of the ISC in tumors are partly related to the increased energy demand arising from cell proliferation, because negative sodium gradients across the cell membranes are maintained by consumption of adenosine triphosphate.52 In addition, the Na+/H+ exchanger isoform (NHE1) (SLC9A1) is upregulated in gliomas and is a potential therapeutic target due to its role in the progression of malignant gliomas,53⇓-55 influence on pH homeostasis in glioma cells,54⇓⇓-57 influence on seizure activity,6 and potential increased resistance to both chemoradiation58 and anti-PD-1 immunotherapy.56

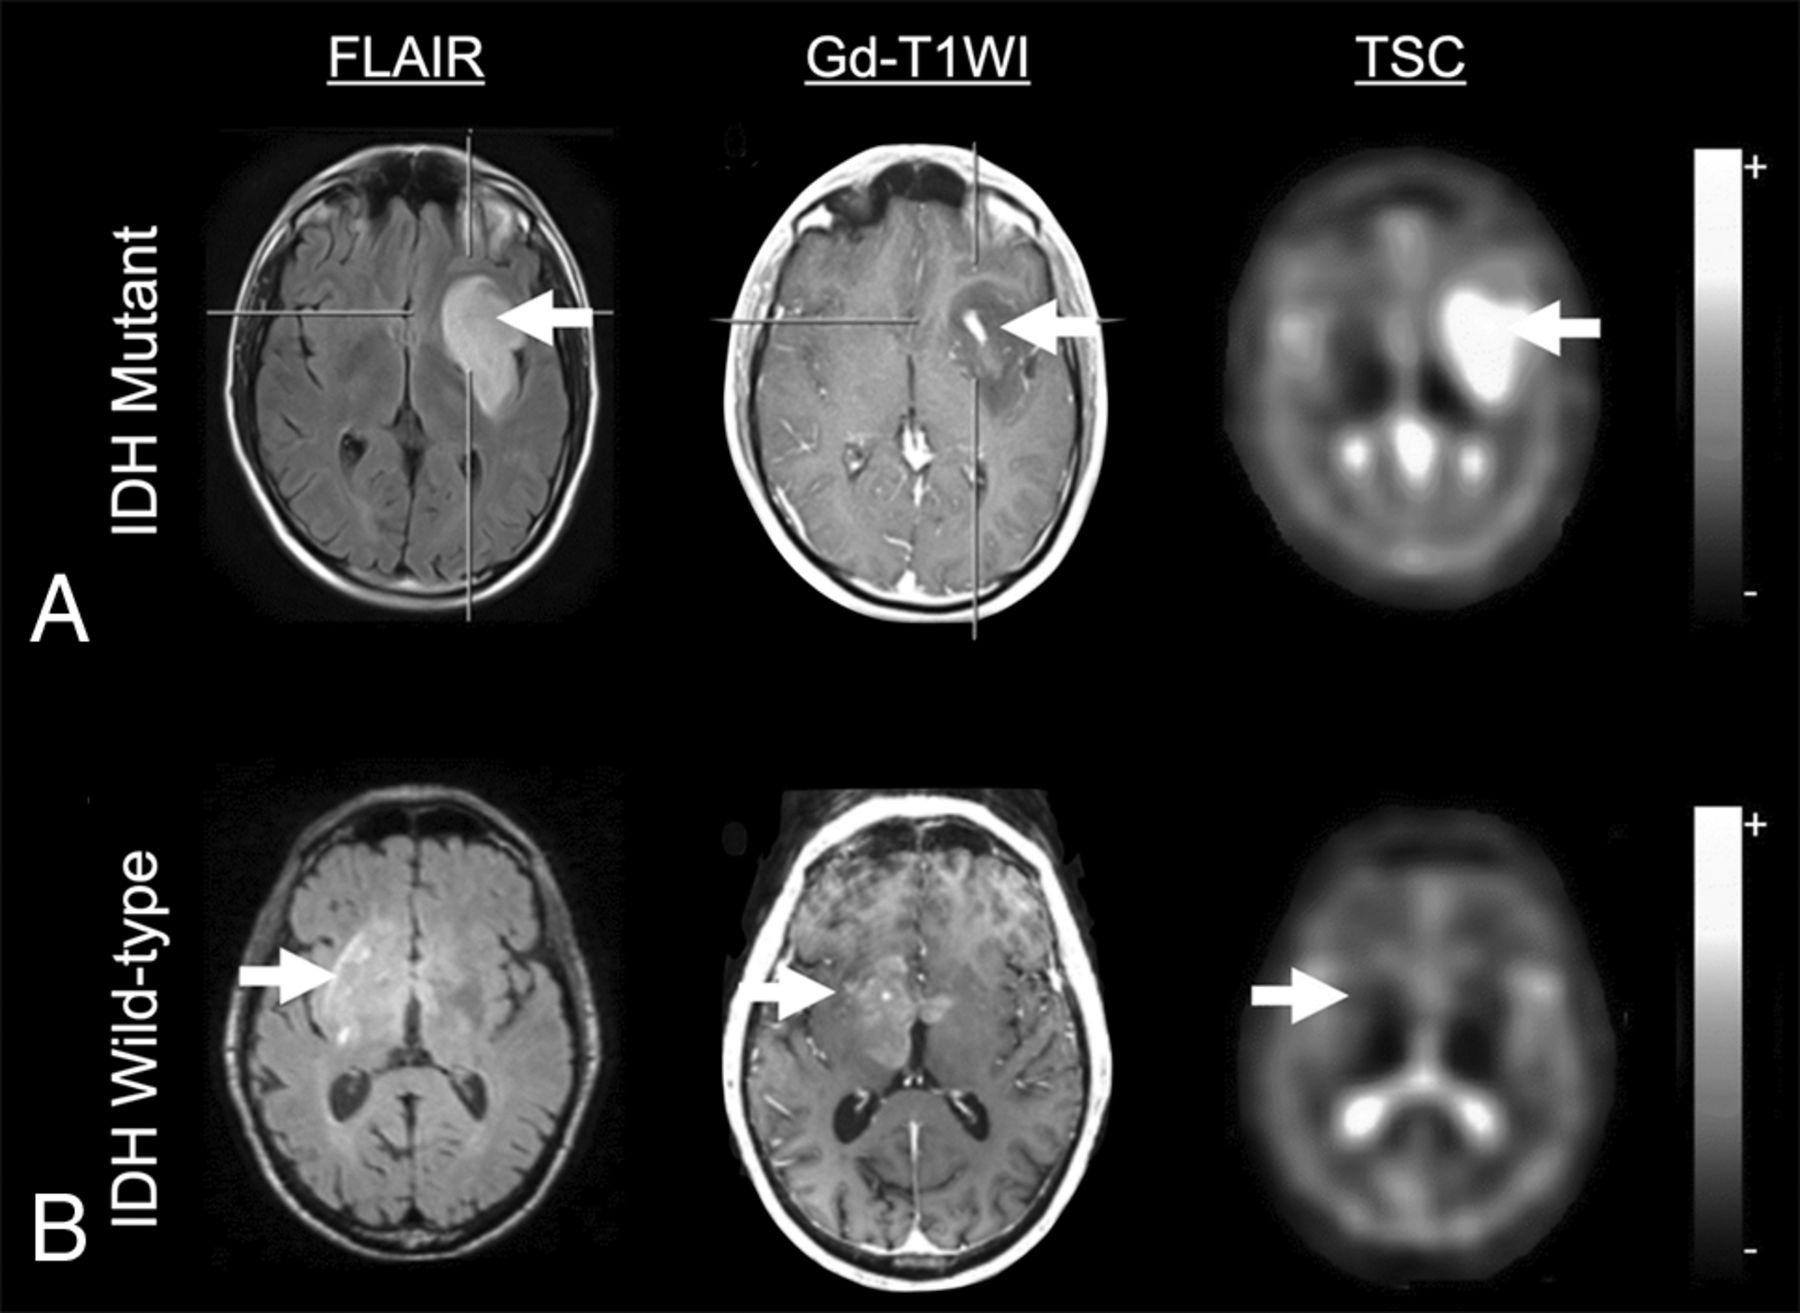
Although the literature is sparse, studies have shown differences in sodium MR imaging contrast among different tumor grades48,59 and between active tumors and peritumoral edema46 or other types of lesions,60 and these differences appear to reflect the general prognosis,59 with higher TSC in areas of more aggressive tumor. Despite this general trend, a number of studies have shown differences in sodium MR imaging contrast between isocitrate dehydrogenase (IDH) mutant and wild-type gliomas,22,59,61 with IDH-mutant human gliomas showing higher TSC than IDH wild-type gliomas (Fig 1).22,61 While this finding is counterintuitive, it could be due to the lower cellular density of IDH-mutant gliomas,62 leading to a larger extracellular space and higher TSC. Alternatively, IDH-mutant gliomas often result in more frequent seizures compared with more aggressive high-grade IDH wild-type malignant gliomas,63,64 and because expression of NHE1s is strongly linked to seizure activity,6 this finding may also explain the differences in TSC observed between IDH-mutant and wild-type gliomas.

FIG 1.
  • Download figure
  • Open in new tab
  • Download powerpoint
FIG 1.

A, MR imaging of a 38-year-old male patient with an IDH-mutated glioblastoma, World Health Organization grade IV. The tumor (white arrows) shows focal contrast enhancement in the T1-weighted image and is clearly depicted in the FLAIR image. Sodium imaging shows increased TSC. B, MR imaging of a 78-year-old male patient with an IDH wild-type anaplastic astrocytoma, World Health Organization grade III, in the right basal ganglia. The tumor (white arrows) shows focal contrast enhancement in the T1-weighted image and diffuse abnormalities in the FLAIR image. Sodium imaging shows no abnormality. Adapted and reproduced with permission from Shymanskaya et al.22

Sodium MR imaging has also shown some promise in identifying the early treatment response in brain tumors.39,65,66 For example, in rat glioma models, response to chemotherapy using sodium MR imaging was detectable even earlier than in proton diffusion MR imaging.67 In rat models of subcutaneously implanted gliomas, lower total sodium signals were observed in gliomas treated with 1,3-Bis(2-chloroethyl)-1-nitrosourea compared with untreated gliomas.68 Another study showed a pronounced increase in the TSC following 1,3-Bis(2-chloroethyl)-1-nitrosourea treatment in orthotropic rat gliomas compared with untreated gliomas.50 Notably, the increase in TSC after treatment occurred before tumor shrinkage. Even though the discrepancy in the results between these 2 studies may partly lie in differences in the implantation sites of gliomas and acquisition methods, the increase in TSC observed in the latter study may also be due to a combination of treatment response leading to necrosis and an increase in the extracellular space. Additionally, Thulborn et al39 evaluated the effects of the standard chemoradiotherapy on 20 patients with human glioblastomas using sodium MR imaging and noted an increase in TSC after successful treatment.

Acute Ischemic Stroke.

Acute ischemic stroke occurs due to sudden occlusion of arteries within the brain, resulting in reductions of adenosine triphosphate production and Na+/K+-ATPase activity. Inadequate Na+/K+-ATPase activity disrupts the ion homeostasis, leading to an increase in the ISC, cytotoxic cell swelling, and eventual cell death.69 Sodium MR imaging may be useful as a surrogate marker of Na+/K+-ATPase activity and cell viability in the ischemic tissue, with potential implications for determining tissue viability.70 Monotonic increases in the TSC after acute ischemic stroke have been reported both in animals71,72 and humans,73,74 using time scales relevant for patient management (ie, 0–24 hours following onset), and this increase does not appear to normalize in the natural course following stroke. In contrast, decreased ADC in the acute phase normalizes when vasogenic edema starts in the subacute phase (ie, 24–72 hours following onset).75 Hussain et al73 demonstrated that there was a 10% increase in sodium signal in the first 7 hours, followed by a rapid increase in sodium until a plateau of a 69% increase at 48 hours relative to baseline values, during which time the ADC did not fluctuate. Because sodium concentration correlates with the duration of ischemia, the onset time may be more accurately estimated by the sodium concentration than diffusion MR imaging changes, providing potential utility in “wake-up” strokes.

Additional studies have demonstrated that sodium MR imaging signals in the region with a perfusion-diffusion mismatch may not differ from those in contralateral normal tissue until around 32 hours after symptom onset, indicating that sodium MR imaging may help identify the viable tissue in the penumbra, even when the onset time of a stroke is unknown (Fig 2).76 Despite these initial studies, the specific thresholds of TSC for determining reversible and irreversible ischemic tissues and the vulnerability of infarcted tissues to hemorrhage following reperfusion therapy are yet to be determined. Conceivably, sodium MR imaging in combination with conventional imaging techniques may enable more judicious selection of candidates for endovascular thrombectomy in the future, rather than using a fixed time window as is the current practice.

FIG 2.
  • Download figure
  • Open in new tab
  • Download powerpoint
FIG 2.

Images of a representative section from a patient with ischemic stroke showing the hypoperfused (time-to-maximum + 4 seconds) perfusion maps, the DWI with a DWI-hyperintense core in the dotted outline, the PWI-DWI mismatch tissue (penumbra) in the solid outline, and sodium images for (A) 4 and (B) 25.5 hours after the onset. This patient had a perfusion/diffusion mismatch at the first time point. The absolute lesion volume of the core enlarged from the first to the second time point, while the penumbral volume diminished. Note that the sodium signal is not increased in the first time point, while the high sodium signal is matched with DWI hyperintensity at the second time point. Adapted and reproduced with permission from Tsang et al.76

Epilepsy.

Because sodium homeostasis affects neuronal excitability,6 sodium MR imaging has the potential to detect subtle disturbances in sodium concentration in seizure disorders including epilepsy. Several pathologic mechanisms in epilepsy are implicated in the change of the TSC observed in the brain, with the primary mechanism being dysfunction of sodium channels and Na+/K+-ATPase in patients with epilepsy due to genetic mutation and mitochondrial dysfunction, leading to depolarization and the increase in the ISC.77⇓-79 Additionally, reduction in the size of the extracellular space due to an increase in the intracellular osmolarity can occur during seizure activity,80,81 and an increase in the extracellular space due to neuronal loss, gliosis, and blood-brain barrier disruption, arising from chronic epilepsy or underlying diseases such as stroke or trauma, can lead to alterations in TSC measurements using sodium MR imaging.82

Despite the potential impact, to date, very few sodium MR imaging studies have been performed in epilepsy and seizure disorders. Wang et al83 reported a dynamic postictal temporal change in proton ADC and TSC using sodium MR imaging after the administration of kainic acid to rats. In the pyriform cortex and amygdala, decreases in the ADC were noted as early as 5 hours after kainic acid administration, and the ADC values further decreased until 24 hours after the seizures. ADC values returned to normal levels 7 days postictally. Meanwhile, the TSC did not change at 5 hours postictally but increased at 24 hours and remained elevated even at 7 days postictally. These changes in ADC and TSC were interpreted as being influenced by sodium entry into the excited neurons and accompanying cellular swelling, followed by energy deficiencies and cell death, in line with pathologically-confirmed extensive neuronal cell loss by day 7. However, future research is desired to elucidate the relationship between the change in sodium concentration and pathophysiology in more detail by using shift reagents in animal models, to determine the degree of contribution by the change in the ISC to the increased TSC.

Additionally, Ridley et al38 used sodium MR imaging to examine 9 patients with epilepsy during interictal periods and 1 patient who incidentally presented with several seizures during the MR imaging examination. TSC in the intracerebral electroencephalogram-defined epileptogenic regions was increased in the interictal group, a finding that can be explained by an increase in the ISC due to voltage-gated sodium channel mutations leading to a persistent inward sodium current, along with an increase in the extracellular space due to cell loss and glial formation (Fig 3).6,82 In contrast to patients in the interictal period and consistent with preclinical studies, the TSC was slightly decreased in the epileptogenic area in the patient who presented with multiple seizures during the MR imaging examination. Together, these preliminary studies suggest that sodium MR imaging may be useful for identification and illumination of epileptic activity, but important questions remain, including the precise temporal changes in TSC that occur during and after seizure activity, the effects of antiepileptic medication, the sensitivity of sodium MR imaging for epileptic foci detection compared with standard proton MR imaging, and the value of sodium MR imaging as a tool to predict surgical outcome in patients with refractory epilepsy.

FIG 3.
  • Download figure
  • Open in new tab
  • Download powerpoint
FIG 3.

A patient with a cortical malformation. The TSC map shows high value on a cortical malformation that is subtle on high-resolution proton 3D-T1-weighted image (arrows) (adapted and reproduced with permission from Ridley et al38). However, the effect of the partial volume effect should be examined in a future study with the achievement of higher-resolution sodium MR imaging.

CONCLUSIONS

Sodium MR imaging has the potential to complement routine proton MR imaging examinations with the goal of improving diagnosis, disease characterization, and clinical monitoring in neurologic diseases. In the past, the utility and exploration of sodium MR imaging as a valuable clinical tool have been limited due to the extremely low MR signal, but with recent improvements in imaging techniques and hardware, sodium MR imaging is on the verge of becoming clinically feasible for conditions including brain tumors, stroke, and epilepsy.

Footnotes

  • This work was supported by American Cancer Society Research Scholar Grant (RSG-15-003-01-CCE), the UCLA SPORE in Brain Cancer grant (NIH/NCI 1P50CA211015-01A1), and the UCLA Department of Radiology Sodium Imaging Program.

  • Disclosures: Akifumi Hagiwara—RELATED: Grant: Japan Society for the Promotion of Science Grants-in-Aid for Scientific Research, Comments: 19K17150.

Indicates open access to non-subscribers at www.ajnr.org

References

  1. 1.↵
    1. Noda M,
    2. Hiyama TY
    . Sodium sensing in the brain. Pflugers Arch 2015;467:465–74 doi:10.1007/s00424-014-1662-4 pmid:25491503
    CrossRefPubMed
  2. 2.↵
    1. Hernandez CM,
    2. Richards JR
    . Physiology, Sodium Channels. StatPearls Publishing; 2021
  3. 3.↵
    1. Joseph D,
    2. Pidathala S,
    3. Mallela AK, et al
    . Structure and gating dynamics of Na(+)/Cl(-) coupled neurotransmitter transporters. Front Mol Biosci 2019;6:80 doi:10.3389/fmolb.2019.00080 pmid:31555663
    CrossRefPubMed
  4. 4.↵
    1. Dekker LJM,
    2. Wu S,
    3. Jurriens C, et al
    . Metabolic changes related to the IDH1 mutation in gliomas preserve TCA-cycle activity: an investigation at the protein level. FASEB J 2020;34:3646–57 doi:10.1096/fj.201902352R pmid:31960518
    CrossRefPubMed
  5. 5.↵
    1. Lo WD,
    2. Betz AL,
    3. Schielke GP, et al
    . Transport of sodium from blood to brain in ischemic brain edema. Stroke 1987;18:150–57 doi:10.1161/01.str.18.1.150 pmid:3810748
    Abstract/FREE Full Text
  6. 6.↵
    1. Kaplan DI,
    2. Isom LL,
    3. Petrou S
    . Role of sodium channels in epilepsy. Cold Spring Harb Perspect Med 2016;6:a022814 doi:10.1101/cshperspect.a022814 pmid:27143702
    Abstract/FREE Full Text
  7. 7.↵
    1. Madelin G,
    2. Regatte RR
    . Biomedical applications of sodium MRI in vivo. J Magn Reson Imaging 2013;38:511–29 doi:10.1002/jmri.24168 pmid:23722972
    CrossRefPubMed
  8. 8.↵
    1. Rooney WD,
    2. Springer CS Jr..
    The molecular environment of intracellular sodium: 23Na NMR relaxation. NMR Biomed 1991;4:227–45 doi:10.1002/nbm.1940040503 pmid:1751346
    CrossRefPubMed
  9. 9.↵
    1. Tsang A,
    2. Stobbe RW,
    3. Beaulieu C
    . Triple-quantum-filtered sodium imaging of the human brain at 4.7 T. Magn Reson Med 2012;67:1633–43 doi:10.1002/mrm.23147 pmid:21956282
    CrossRefPubMed
  10. 10.↵
    1. Liao Y,
    2. Lechea N,
    3. Magill AW, et al
    . Correlation of quantitative conductivity mapping and total tissue sodium concentration at 3T/4T. Magn Reson Med 2019;82:1518–26 doi:10.1002/mrm.27787 pmid:31095776
    CrossRefPubMed
  11. 11.↵
    1. Qian Y,
    2. Zhao T,
    3. Zheng H, et al
    . High-resolution sodium imaging of human brain at 7 T. Magn Reson Med 2012;68:227–33 doi:10.1002/mrm.23225 pmid:22144258
    CrossRefPubMed
  12. 12.↵
    1. Thulborn K,
    2. Lui E,
    3. Guntin J, et al
    . Quantitative sodium MRI of the human brain at 9.4 T provides assessment of tissue sodium concentration and cell volume fraction during normal aging. NMR Biomed 2016;29:137–43 doi:10.1002/nbm.3312 pmid:26058461
    CrossRefPubMed
  13. 13.↵
    1. Harrington MG,
    2. Salomon RM,
    3. Pogoda JM, et al
    . Cerebrospinal fluid sodium rhythms. Cerebrospinal Fluid Res 2010;7:3 doi:10.1186/1743-8454-7-3 pmid:20205754
    CrossRefPubMed
  14. 14.↵
    1. Bansal N,
    2. Germann MJ,
    3. Seshan V, et al
    . Thulium 1,4,7,10-tetraazacyclododecane-1,4,7,10-tetrakis(methylene phosphonate) as a 23Na shift reagent for the in vivo rat liver. Biochemistry 1993;32:5638–43 doi:10.1021/bi00072a020 pmid:8504084
    CrossRefPubMed
  15. 15.↵
    1. Winter PM,
    2. Bansal N
    . TmDOTP(5-) as a (23)Na shift reagent for the subcutaneously implanted 9L gliosarcoma in rats. Magn Reson Med 2001;45:436–42 doi:10.1002/1522-2594(200103)45:3<436::AID-MRM1057>3.0.CO;2-6 pmid:11241701
    CrossRefPubMed
  16. 16.↵
    1. Stobbe R,
    2. Beaulieu C
    . In vivo sodium magnetic resonance imaging of the human brain using soft inversion recovery fluid attenuation. Magn Reson Med 2005;54:1305–10 doi:10.1002/mrm.20696 pmid:16217782
    CrossRefPubMed
  17. 17.↵
    1. Madelin G,
    2. Kline R,
    3. Walvick R, et al
    . A method for estimating intracellular sodium concentration and extracellular volume fraction in brain in vivo using sodium magnetic resonance imaging. Sci Rep 2014;4:4763 doi:10.1038/srep04763 pmid:24755879
    CrossRefPubMed
  18. 18.↵
    1. Barrett T,
    2. Riemer F,
    3. McLean MA, et al
    . Quantification of total and intracellular sodium concentration in primary prostate cancer and adjacent normal prostate tissue with magnetic resonance imaging. Invest Radiol 2018;53:450–56 doi:10.1097/RLI.0000000000000470 pmid:29969108
    CrossRefPubMed
  19. 19.↵
    1. Nunes Neto LP,
    2. Madelin G,
    3. Sood TP, et al
    . Quantitative sodium imaging and gliomas: a feasibility study. Neuroradiology 2018;60:795–802 doi:10.1007/s00234-018-2041-1 pmid:29862413
    CrossRefPubMed
  20. 20.↵
    1. Hancu I,
    2. Boada FE,
    3. Shen GX
    . Three-dimensional triple-quantum-filtered (23)Na imaging of in vivo human brain. Magn Reson Med 1999;42:1146–54 doi:10.1002/(SICI)1522-2594(199912)42:6<1146::AID-MRM20>3.0.CO;2-S pmid:10571937
    CrossRefPubMed
  21. 21.↵
    1. Fiege DP,
    2. Romanzetti S,
    3. Mirkes CC, et al
    . Simultaneous single-quantum and triple-quantum-filtered MRI of 23Na (SISTINA). Magn Reson Med 2013;69:1691–96 doi:10.1002/mrm.24417 pmid:22829484
    CrossRefPubMed
  22. 22.↵
    1. Shymanskaya A,
    2. Worthoff WA,
    3. Stoffels G, et al
    . Comparison of [18F]Fluoroethyltyrosine PET and sodium MRI in cerebral gliomas: a pilot study. Mol Imaging Biol 2020;22:198–207 doi:10.1007/s11307-019-01349-y pmid:30989437
    CrossRefPubMed
  23. 23.↵
    1. Shinar H,
    2. Navon G
    . NMR relaxation studies of intracellular Na+ in red blood cells. Biophys Chem 1984;20:275–83 doi:10.1016/0301-4622(84)80018-6 pmid:6509150
    CrossRefPubMed
  24. 24.↵
    1. Burstein D,
    2. Fossel ET
    . Intracellular sodium and lithium NMR relaxation times in the perfused frog heart. Magn Reson Med 1987;4:261–73 doi:10.1002/mrm.1910040307 pmid:3494902
    CrossRefPubMed
  25. 25.↵
    1. Foy BD,
    2. Burstein D
    . Interstitial sodium nuclear magnetic resonance relaxation times in perfused hearts. Biophys J 1990;58:127–34 doi:10.1016/S0006-3495(90)82358-4 pmid:2383627
    CrossRefPubMed
  26. 26.↵
    1. Jelicks LA,
    2. Paul PK,
    3. O’Byrne E, et al
    . Hydrogen-1, sodium-23, and carbon-13 MR spectroscopy of cartilage degradation in vitro. J Magn Reson Imaging 1993;3:565–68 doi:10.1002/jmri.1880030403 pmid:8347947
    CrossRefPubMed
  27. 27.↵
    1. Burstein D,
    2. Springer CS Jr..
    Sodium MRI revisited. Magn Reson Med 2019;82:521–24 doi:10.1002/mrm.27738 pmid:30927278
    CrossRefPubMed
  28. 28.↵
    1. Lachner S,
    2. Ruck L,
    3. Niesporek SC, et al
    . Comparison of optimized intensity correction methods for 23Na MRI of the human brain using a 32-channel phased array coil at 7 Tesla. Z Med Phys 2020;30:104–15 doi:10.1016/j.zemedi.2019.10.004 pmid:31866116
    CrossRefPubMed
  29. 29.↵
    1. Lei Y,
    2. Han H,
    3. Yuan F, et al
    . The brain interstitial system: anatomy, modeling, in vivo measurement, and applications. Prog Neurobiol 2017;157:230–46 doi:10.1016/j.pneurobio.2015.12.007 pmid:26837044
    CrossRefPubMed
  30. 30.↵
    1. LaVerde G,
    2. Nemoto E,
    3. Jungreis CA, et al
    . Serial triple quantum sodium MRI during non-human primate focal brain ischemia. Magn Reson Med 2007;57:201–05 doi:10.1002/mrm.21087 pmid:17191243
    CrossRefPubMed
  31. 31.↵
    1. Jelicks LA,
    2. Gupta RK
    . Multinuclear NMR studies of the Langendorff perfused rat heart. J Biol Chem 1989;264:15230–35 doi:10.1016/S0021-9258(19)84814-7 pmid:2768258
    Abstract/FREE Full Text
  32. 32.↵
    1. Hutchison RB,
    2. Malhotra D,
    3. Hendrick RE, et al
    . Evaluation of the double-quantum filter for the measurement of intracellular sodium concentration. J Biol Chem 1990;265:15506–10 pmid:2394737
    Abstract/FREE Full Text
  33. 33.↵
    1. Jelicks LA,
    2. Gupta RK
    . On the extracellular contribution to multiple quantum filtered 23Na NMR of perfused rat heart. Magn Reson Med 1993;29:130–33 doi:10.1002/mrm.1910290124 pmid:8419734
    CrossRefPubMed
  34. 34.↵
    1. Gaw N,
    2. Hawkins-Daarud A,
    3. Hu LS, et al
    . Integration of machine learning and mechanistic models accurately predicts variation in cell density of glioblastoma using multiparametric MRI. Sci Rep 2019;9:10063 doi:10.1038/s41598-019-46296-4 pmid:31296889
    CrossRefPubMed
  35. 35.↵
    1. Lu A,
    2. Atkinson IC,
    3. Claiborne TC, et al
    . Quantitative sodium imaging with a flexible twisted projection pulse sequence. Magn Reson Med 2010;63:1583–93 doi:10.1002/mrm.22381 pmid:20512862
    CrossRefPubMed
  36. 36.↵
    1. Shah NJ,
    2. Worthoff WA,
    3. Langen KJ
    . Imaging of sodium in the brain: a brief review. NMR Biomed 2016;29:162–74 doi:10.1002/nbm.3389 pmid:26451752
    CrossRefPubMed
  37. 37.↵
    1. Zaric O,
    2. Juras V,
    3. Szomolanyi P, et al
    . Frontiers of sodium MRI revisited: from cartilage to brain imaging. J Magn Reson Imaging 2021;54:e27326–75 doi:10.1002/jmri.27326 pmid:32851736
    CrossRefPubMed
  38. 38.↵
    1. Ridley B,
    2. Marchi A,
    3. Wirsich J, et al
    . Brain sodium MRI in human epilepsy: Disturbances of ionic homeostasis reflect the organization of pathological regions. Neuroimage 2017;157:173–83 doi:10.1016/j.neuroimage.2017.06.011 pmid:28602596
    CrossRefPubMed
  39. 39.↵
    1. Thulborn KR,
    2. Lu A,
    3. Atkinson IC, et al
    . Residual tumor volume, cell volume fraction, and tumor cell kill during fractionated chemoradiation therapy of human glioblastoma using quantitative sodium MR imaging. Clin Cancer Res 2019;25:1226–32 doi:10.1158/1078-0432.CCR-18-2079 pmid:30487127
    Abstract/FREE Full Text
  40. 40.↵
    1. Wiggins GC,
    2. Brown R,
    3. Lakshmanan K
    . High-performance radiofrequency coils for (23)Na MRI: brain and musculoskeletal applications. NMR Biomed 2016;29:96–106 doi:10.1002/nbm.3379 pmid:26404631
    CrossRefPubMed
  41. 41.↵
    1. Wilcox M,
    2. Wright SM,
    3. McDougall M
    . A review of non-1H RF receive arrays in magnetic resonance imaging and spectroscopy. IEEE Open J Eng Med Biol 2020;1:290–300 doi:10.1109/OJEMB.2020.3030531
    CrossRef
  42. 42.↵
    1. Lee RF,
    2. Giaquinto R,
    3. Constantinides C, et al
    . A broadband phased-array system for direct phosphorus and sodium metabolic MRI on a clinical scanner. Magn Reson Med 2000;43:269–77 doi:10.1002/(SICI)1522-2594(200002)43:2<269::AID-MRM14>3.0.CO;2-J pmid:10680691
    CrossRefPubMed
  43. 43.↵
    1. Zamecnik J
    . The extracellular space and matrix of gliomas. Acta Neuropathol 2005;110:435–42 doi:10.1007/s00401-005-1078-5 pmid:16175354
    CrossRefPubMed
  44. 44.↵
    1. Amara S,
    2. Tiriveedhi V
    . Inflammatory role of high salt level in tumor microenvironment (review). Int J Oncol 2017;50:1477–81 doi:10.3892/ijo.2017.3936 pmid:28350105
    CrossRefPubMed
  45. 45.↵
    1. Leslie TK,
    2. James AD,
    3. Zaccagna F, et al
    . Sodium homeostasis in the tumour microenvironment. Biochim Biophys Acta Rev Cancer 2019;1872:188304 doi:10.1016/j.bbcan.2019.07.001 pmid:31348974
    CrossRefPubMed
  46. 46.↵
    1. Ouwerkerk R,
    2. Bleich KB,
    3. Gillen JS, et al
    . Tissue sodium concentration in human brain tumors as measured with 23Na MR imaging. Radiology 2003;227:529–37 doi:10.1148/radiol.2272020483 pmid:12663825
    CrossRefPubMed
  47. 47.↵
    1. Bartha R,
    2. Megyesi JF,
    3. Watling CJ
    . Low-grade glioma: correlation of short echo time 1H-MR spectroscopy with 23Na MR imaging. AJNR Am J Neuroradiol 2008;29:464–70 doi:10.3174/ajnr.A0854 pmid:18238848
    Abstract/FREE Full Text
  48. 48.↵
    1. Nagel AM,
    2. Bock M,
    3. Hartmann C, et al
    . The potential of relaxation-weighted sodium magnetic resonance imaging as demonstrated on brain tumors. Invest Radio 2011;46:539–47 doi:10.1097/RLI.0b013e31821ae918 pmid:21577129
    CrossRefPubMed
  49. 49.↵
    1. Thulborn KR,
    2. Davis D,
    3. Adams H, et al
    . Quantitative tissue sodium concentration mapping of the growth of focal cerebral tumors with sodium magnetic resonance imaging. Magn Reson Med 1999;41:351–59 doi:10.1002/(SICI)1522-2594(199902)41:2<351::AID-MRM20>3.0.CO;2-H pmid:10080284
    CrossRefPubMed
  50. 50.↵
    1. Schepkin VD,
    2. Ross BD,
    3. Chenevert TL, et al
    . Sodium magnetic resonance imaging of chemotherapeutic response in a rat glioma. Magn Reson Med 2005;53:85–92 doi:10.1002/mrm.20332 pmid:15690506
    CrossRefPubMed
  51. 51.↵
    1. Thulborn KR,
    2. Lu A,
    3. Atkinson IC, et al
    . Quantitative sodium MR imaging and sodium bioscales for the management of brain tumors. Neuroimaging Clin N Am 2009;19:615–24 doi:10.1016/j.nic.2009.09.001 pmid:19959008
    CrossRefPubMed
  52. 52.↵
    1. Kuhn SA,
    2. Mueller U,
    3. Hanisch UK, et al
    . Glioblastoma cells express functional cell membrane receptors activated by daily used medical drugs. J Cancer Res Clin Oncol 2009;135:1729–45 doi:10.1007/s00432-009-0620-6 pmid:19543745
    CrossRefPubMed
  53. 53.↵
    1. Cong D,
    2. Zhu W,
    3. Kuo JS, et al
    . Ion transporters in brain tumors. Curr Med Chem 2015;22:1171–81 doi:10.2174/0929867322666150114151946 pmid:25620102
    CrossRefPubMed
  54. 54.↵
    1. McLean LA,
    2. Roscoe J,
    3. Jorgensen NK, et al
    . Malignant gliomas display altered pH regulation by NHE1 compared with nontransformed astrocytes. Am J Physiol Cell Physiol 2000;278:C676–88 doi:10.1152/ajpcell.2000.278.4.C676 pmid:10751317
    CrossRefPubMed
  55. 55.↵
    1. Zhu W,
    2. Carney KE,
    3. Pigott VM, et al
    . Glioma-mediated microglial activation promotes glioma proliferation and migration: roles of Na+/H+ exchanger isoform 1. Carcinogenesis 2016;37:839–51 doi:10.1093/carcin/bgw068 pmid:27287871
    CrossRefPubMed
  56. 56.↵
    1. Guan X,
    2. Hasan MN,
    3. Begum G, et al
    . Blockade of Na/H exchanger stimulates glioma tumor immunogenicity and enhances combinatorial TMZ and anti-PD-1 therapy. Cell Death Dis 2018;9:1010 doi:10.1038/s41419-018-1062-3 pmid:30262908
    CrossRefPubMed
  57. 57.↵
    1. Stock C,
    2. Pedersen SF
    . Roles of pH and the Na(+)/H(+) exchanger NHE1 in cancer: From cell biology and animal models to an emerging translational perspective? Semin Cancer Biol 2017;43:5–16 doi:10.1016/j.semcancer.2016.12.001 pmid:28007556
    CrossRefPubMed
  58. 58.↵
    1. Cong D,
    2. Zhu W,
    3. Shi Y, et al
    . Upregulation of NHE1 protein expression enables glioblastoma cells to escape TMZ-mediated toxicity via increased H(+) extrusion, cell migration and survival. Carcinogenesis 2014;35:2014–24 doi:10.1093/carcin/bgu089 pmid:24717311
    CrossRefPubMed
  59. 59.↵
    1. Biller A,
    2. Badde S,
    3. Nagel A, et al
    . Improved brain tumor classification by sodium MR imaging: prediction of IDH mutation status and tumor progression. AJNR Am J Neuroradiol 2016;37:66–73 doi:10.3174/ajnr.A4493 pmid:26494691
    Abstract/FREE Full Text
  60. 60.↵
    1. Hashimoto T,
    2. Ikehira H,
    3. Fukuda H, et al
    . In vivo sodium-23 MRI in brain tumors: evaluation of preliminary clinical experience. Am J Physiol Imaging 1991;6:74–80
    PubMed
  61. 61.↵
    1. Regnery S,
    2. Behl NG,
    3. Platt T, et al
    . Ultra-high-field sodium MRI as biomarker for tumor extent, grade and IDH mutation status in glioma patients. Neuroimage Clin 2020;28:102427 doi:10.1016/j.nicl.2020.102427 pmid:33002860
    CrossRefPubMed
  62. 62.↵
    1. Xing Z,
    2. Yang X,
    3. She D, et al
    . Noninvasive assessment of IDH mutational status in World Health Organization grade II and III astrocytomas using DWI and DSC-PWI combined with conventional MR imaging. AJNR Am J Neuroradiol 2017;38:1138–44 doi:10.3174/ajnr.A5171 pmid:28450436
    Abstract/FREE Full Text
  63. 63.↵
    1. Li Y,
    2. Shan X,
    3. Wu Z, et al
    . IDH1 mutation is associated with a higher preoperative seizure incidence in low-grade glioma: a systematic review and meta-analysis. Seizure 2018;55:76–82 doi:10.1016/j.seizure.2018.01.011 pmid:29414139
    CrossRefPubMed
  64. 64.↵
    1. Ozer B,
    2. Bui Y,
    3. Markovic D, et al
    . NCMP-01: seizure control after initial presentation in IDH mutated glioma patients. Neuro Oncol 2017;19(Supple 6):vi135–36 doi:10.1093/neuonc/nox168.555
    CrossRef
  65. 65.↵
    1. Laymon CM,
    2. Oborski MJ,
    3. Lee VK, et al
    . Combined imaging biomarkers for therapy evaluation in glioblastoma multiforme: correlating sodium MRI and F-18 FLT PET on a voxel-wise basis. Magn Reson Imaging 2012;30:1268–78 doi:10.1016/j.mri.2012.05.011 pmid:22819581
    CrossRefPubMed
  66. 66.↵
    1. Haneder S,
    2. Giordano FA,
    3. Konstandin S, et al
    . 2³Na-MRI of recurrent glioblastoma multiforme after intraoperative radiotherapy: technical note. Neuroradiology 2015;57:321–26 doi:10.1007/s00234-014-1468-2 pmid:25428586
    CrossRefPubMed
  67. 67.↵
    1. Schepkin VD
    . Sodium MRI of glioma in animal models at ultrahigh magnetic fields. NMR Biomed 2016;29:175–86 doi:10.1002/nbm.3347 pmid:26174529
    CrossRefPubMed
  68. 68.↵
    1. Winter PM,
    2. Poptani H,
    3. Bansal N
    . Effects of chemotherapy by 1,3-bis(2-chloroethyl)-1-nitrosourea on single-quantum- and triple-quantum-filtered 23Na and 31P nuclear magnetic resonance of the subcutaneously implanted 9L glioma. Cancer Res 2001;61:2002–07 pmid:11280759
    Abstract/FREE Full Text
  69. 69.↵
    1. Dijkstra K,
    2. Hofmeijer J,
    3. van Gils SA, et al
    . A biophysical model for cytotoxic cell swelling. J Neurosci 2016;36:11881–90 doi:10.1523/JNEUROSCI.1934-16.2016 pmid:27881775
    Abstract/FREE Full Text
  70. 70.↵
    1. Dani KA,
    2. Warach S
    . Metabolic imaging of ischemic stroke: the present and future. AJNR Am J Neuroradiol 2014;35:S37–43 doi:10.3174/ajnr.A3789 pmid:24722308
    Abstract/FREE Full Text
  71. 71.↵
    1. Thulborn KR,
    2. Gindin TS,
    3. Davis D, et al
    . Comprehensive MR imaging protocol for stroke management: tissue sodium concentration as a measure of tissue viability in nonhuman primate studies and in clinical studies. Radiology 1999;213:156–66 doi:10.1148/radiology.213.1.r99se15156 pmid:10540656
    CrossRefPubMed
  72. 72.↵
    1. Wang Y,
    2. Hu W,
    3. Perez-Trepichio AD, et al
    . Brain tissue sodium is a ticking clock telling time after arterial occlusion in rat focal cerebral ischemia. Stroke 2000;31:1386–91; discussion 92 doi:10.1161/01.STR.31.6.1386 pmid:10835461
    Abstract/FREE Full Text
  73. 73.↵
    1. Hussain MS,
    2. Stobbe RW,
    3. Bhagat YA, et al
    . Sodium imaging intensity increases with time after human ischemic stroke. Ann Neurol 2009;66:55–62 doi:10.1002/ana.21648 pmid:19670436
    CrossRefPubMed
  74. 74.↵
    1. Neumaier-Probst E,
    2. Konstandin S,
    3. Ssozi J, et al
    . A double-tuned (1) H/(23) Na resonator allows (1) H-guided (23)Na-MRI in ischemic stroke patients in one session. Int J Stroke 2015;10:56–61 doi:10.1111/ijs.12547 pmid:26121064
    CrossRefPubMed
  75. 75.↵
    1. Shen JM,
    2. Xia XW,
    3. Kang WG, et al
    . The use of MRI apparent diffusion coefficient (ADC) in monitoring the development of brain infarction. BMC Med Imaging 2011;11:2 doi:10.1186/1471-2342-11-2 pmid:21211049
    CrossRefPubMed
  76. 76.↵
    1. Tsang A,
    2. Stobbe RW,
    3. Asdaghi N, et al
    . Relationship between sodium intensity and perfusion deficits in acute ischemic stroke. J Magn Reson Imaging 2011;33:41–47 doi:10.1002/jmri.22299 pmid:21182119
    CrossRefPubMed
  77. 77.↵
    1. Cressman JR Jr.,
    2. Ullah G,
    3. Ziburkus J, et al
    . The influence of sodium and potassium dynamics on excitability, seizures, and the stability of persistent states, I: single neuron dynamics. J Comput Neurosci 2009;26:159–70 doi:10.1007/s10827-008-0132-4 pmid:19169801
    CrossRefPubMed
  78. 78.↵
    1. Kunz WS,
    2. Kudin AP,
    3. Vielhaber S, et al
    . Mitochondrial complex I deficiency in the epileptic focus of patients with temporal lobe epilepsy. Ann Neurol 2000;48:766–73 pmid:11079540
    CrossRefPubMed
  79. 79.↵
    1. Folbergrová J,
    2. Kunz WS
    . Mitochondrial dysfunction in epilepsy. Mitochondrion 2012;12:35–40 doi:10.1016/j.mito.2011.04.004 pmid:21530687
    CrossRefPubMed
  80. 80.↵
    1. Dietzel I,
    2. Heinemann U,
    3. Hofmeier G, et al
    . Stimulus-induced changes in extracellular Na+ and Cl- concentration in relation to changes in the size of the extracellular space. Exp Brain Res 1982;46:73–84 doi:10.1007/BF00238100 pmid:6279427
    CrossRefPubMed
  81. 81.↵
    1. Antonio LL,
    2. Anderson ML,
    3. Angamo EA, et al
    . In vitro seizure-like events and changes in ionic concentration. J Neurosci Methods 2016;260:33–44 doi:10.1016/j.jneumeth.2015.08.014
    CrossRefPubMed
  82. 82.↵
    1. Patel DC,
    2. Tewari BP,
    3. Chaunsali L, et al
    . Neuron-glia interactions in the pathophysiology of epilepsy. Nat Rev Neurosci 2019;20:282–97 doi:10.1038/s41583-019-0126-4 pmid:30792501
    CrossRefPubMed
  83. 83.↵
    1. Wang Y,
    2. Majors A,
    3. Najm I, et al
    . Postictal alteration of sodium content and apparent diffusion coefficient in epileptic rat brain induced by kainic acid. Epilepsia 1996;37:1000–06 doi:10.1111/j.1528-1157.1996.tb00539.x pmid:8822700
    CrossRefPubMed
  • Received March 12, 2021.
  • Accepted after revision May 28, 2021.
  • © 2021 by American Journal of Neuroradiology
PreviousNext
Back to top

In this issue

American Journal of Neuroradiology: 42 (11)
American Journal of Neuroradiology
Vol. 42, Issue 11
1 Nov 2021
  • Table of Contents
  • Index by author
  • Complete Issue (PDF)
Advertisement
Print
Download PDF
Email Article

Thank you for your interest in spreading the word on American Journal of Neuroradiology.

NOTE: We only request your email address so that the person you are recommending the page to knows that you wanted them to see it, and that it is not junk mail. We do not capture any email address.

Enter multiple addresses on separate lines or separate them with commas.
Sodium MR Neuroimaging
(Your Name) has sent you a message from American Journal of Neuroradiology
(Your Name) thought you would like to see the American Journal of Neuroradiology web site.
CAPTCHA
This question is for testing whether or not you are a human visitor and to prevent automated spam submissions.
Cite this article
A. Hagiwara, M. Bydder, T.C. Oughourlian, J. Yao, N. Salamon, R. Jahan, J.P. Villablanca, D.R. Enzmann, B.M. Ellingson
Sodium MR Neuroimaging
American Journal of Neuroradiology Nov 2021, 42 (11) 1920-1926; DOI: 10.3174/ajnr.A7261

Citation Manager Formats

  • BibTeX
  • Bookends
  • EasyBib
  • EndNote (tagged)
  • EndNote 8 (xml)
  • Medlars
  • Mendeley
  • Papers
  • RefWorks Tagged
  • Ref Manager
  • RIS
  • Zotero
0 Responses
Respond to this article
Share
Bookmark this article
Sodium MR Neuroimaging
A. Hagiwara, M. Bydder, T.C. Oughourlian, J. Yao, N. Salamon, R. Jahan, J.P. Villablanca, D.R. Enzmann, B.M. Ellingson
American Journal of Neuroradiology Nov 2021, 42 (11) 1920-1926; DOI: 10.3174/ajnr.A7261
del.icio.us logo Twitter logo Facebook logo Mendeley logo
  • Tweet Widget
  • Facebook Like
  • Google Plus One
Purchase

Jump to section

  • Article
    • Abstract
    • ABBREVIATIONS:
    • CONCLUSIONS
    • Footnotes
    • References
  • Figures & Data
  • Info & Metrics
  • Responses
  • References
  • PDF

Related Articles

  • No related articles found.
  • PubMed
  • Google Scholar

Cited By...

  • Investigating sodium homeostasis of structural brain hubs in focal epilepsy using 7T MRI
  • Crossref (13)
  • Google Scholar

This article has been cited by the following articles in journals that are participating in Crossref Cited-by Linking.

  • Challenges, limitations, and pitfalls of PET and advanced MRI in patients with brain tumors: A report of the PET/RANO group
    Norbert Galldiks, Timothy J Kaufmann, Philipp Vollmuth, Philipp Lohmann, Marion Smits, Michael C Veronesi, Karl-Josef Langen, Roberta Rudà, Nathalie L Albert, Elke Hattingen, Ian Law, Markus Hutterer, Riccardo Soffietti, Michael A Vogelbaum, Patrick Y Wen, Michael Weller, Joerg-Christian Tonn
    Neuro-Oncology 2024 26 7
  • Standardized brain tumor imaging protocols for clinical trials: current recommendations and tips for integration
    Francesco Sanvito, Timothy J. Kaufmann, Timothy F. Cloughesy, Patrick Y. Wen, Benjamin M. Ellingson
    Frontiers in Radiology 2023 3
  • Imaging of Suspected Stroke in Children, From the AJR Special Series on Emergency Radiology
    Luis O. Tierradentro-García, Alireza Zandifar, Natalie L. Ullman, Shyam S. B. Venkatakrishna, Jorge D. U. Kim, Robert J. Martin, Cesar A. Alves, Susan Sotardi, Manus J. Donahue, Aashim Bhatia
    American Journal of Roentgenology 2023 220 3
  • Multi-nuclear sodium, diffusion, and perfusion MRI in human gliomas
    Nicholas S. Cho, Francesco Sanvito, Shruti Thakuria, Chencai Wang, Akifumi Hagiwara, Raksha Nagaraj, Sonoko Oshima, Alfredo L. Lopez Kolkovsky, Jianwen Lu, Catalina Raymond, Linda M. Liau, Richard G. Everson, Kunal S. Patel, Won Kim, Isaac Yang, Marvin Bergsneider, Phioanh L. Nghiemphu, Albert Lai, David A. Nathanson, Timothy F. Cloughesy, Benjamin M. Ellingson
    Journal of Neuro-Oncology 2023 163 2
  • A uniformity correction method to reduce scan time for 7T sodium imaging of brain tumors
    Sanghoon Kim, Sai Merugumala, Alexander Peter Lin
    Journal of Neuroimaging 2022 32 6
  • Chronic High-Salt Diet Activates Tumor-Initiating Stem Cells Leading to Breast Cancer Proliferation
    Lisa Tucker, Umer Ali, Roy Zent, Deborah A. Lannigan, Jeffrey C. Rathmell, Venkataswarup Tiriveedhi
    Cells 2024 13 11
  • Resolution enhancement, noise suppression, and joint T2* decay estimation in dual‐echo sodium‐23 MR imaging using anatomically guided reconstruction
    Georg Schramm, Marina Filipovic, Yongxian Qian, Alaleh Alivar, Yvonne W. Lui, Johan Nuyts, Fernando Boada
    Magnetic Resonance in Medicine 2024 91 4
  • Influence of image contrasts and reconstruction methods on the classification of multiple sclerosis‐like lesions in simulated sodium magnetic resonance imaging
    Laurent Ruck, Angelika Mennecke, Tobias Wilferth, Sebastian Lachner, Max Müller, Nico Egger, Arnd Doerfler, Michael Uder, Armin M. Nagel
    Magnetic Resonance in Medicine 2023 89 3
  • Metabolic Imaging of Acute Ischemic Stroke (PET, 1Hydrogen Spectroscopy, 17Oxygen Imaging, 23Sodium MRI, pH Imaging)
    Anil Vasireddi, Pamela W. Schaefer, Saurabh Rohatgi
    Neuroimaging Clinics of North America 2024 34 2
  • Added Value of Sodium MR Imaging and Proton MR Spectroscopy to Conventional MR Imaging for a Better Characterization of the Ischemic Stroke: A Narrative Review
    Maëva Cotinat, Emmanuelle Robinet, Noëlle Messaoudi, Laurent Suissa, Emilie Doche, Maxime Guye, Laurent Bensoussan, Wafaa Zaaraoui, Jean-Philippe Ranjeva
    Magnetic Resonance in Medical Sciences 2025

More in this TOC Section

  • Diagnostic Neuroradiology of Monoclonal Antibodies
  • Clinical Outcomes After Chiari I Decompression
  • Cerebral ADC Changes in Fabry Disease
Show more Adult Brain

Similar Articles

Advertisement

Indexed Content

  • Current Issue
  • Accepted Manuscripts
  • Article Preview
  • Past Issues
  • Editorials
  • Editors Choice
  • Fellow Journal Club
  • Letters to the Editor

Cases

  • Case Collection
  • Archive - Case of the Week
  • Archive - Case of the Month
  • Archive - Classic Case

Special Collections

  • Special Collections

Resources

  • News and Updates
  • Turn around Times
  • Submit a Manuscript
  • Author Policies
  • Manuscript Submission Guidelines
  • Evidence-Based Medicine Level Guide
  • Publishing Checklists
  • Graphical Abstract Preparation
  • Imaging Protocol Submission
  • Submit a Case
  • Become a Reviewer/Academy of Reviewers
  • Get Peer Review Credit from Publons

Multimedia

  • AJNR Podcast
  • AJNR SCANtastic
  • Video Articles

About Us

  • About AJNR
  • Editorial Board
  • Not an AJNR Subscriber? Join Now
  • Alerts
  • Feedback
  • Advertise with us
  • Librarian Resources
  • Permissions
  • Terms and Conditions

American Society of Neuroradiology

  • Not an ASNR Member? Join Now

© 2025 by the American Society of Neuroradiology All rights, including for text and data mining, AI training, and similar technologies, are reserved.
Print ISSN: 0195-6108 Online ISSN: 1936-959X

Powered by HighWire