
Abstract
BACKGROUND AND PURPOSE: The fetal subarachnoid space size serves as an indicator of normal brain development. The subarachnoid space is commonly measured by an ultrasound examination. Introduction of MR imaging for fetal brain evaluation enables standardization of MR imaging–driven subarachnoid space parameters for a more accurate evaluation. This study aimed to determine the normal range of MR imaging–derived subarachnoid space size in fetuses according to gestational age.
MATERIALS AND METHODS: A cross-sectional study based on a retrospective assessment of randomly selected brain MR images of apparently healthy fetuses performed between 2012 and 2020 at a large tertiary medical center was performed. Demographic data were collected from the mothers’ medical records. Subarachnoid space size was measured at 10 reference points using the axial and coronal planes. Only MR imaging scans obtained between weeks 28 and 37 of pregnancy were included. Scans with low-quality images, multiple pregnancy, and cases with intracranial pathologic findings were excluded.
RESULTS: Overall, 214 apparently healthy fetuses were included (mean maternal age, 31.2 [SD, 5.4] years). Good interobserver and intraobserver agreement was observed (intraclass correlation coefficient > 0.75 for all except 1 parameter). For each gestational week, the 3rd, 15th, 50th, 85th, and 97th percentiles of each subarachnoid space measurement were described.
CONCLUSIONS: MR imaging–derived subarachnoid space values at a specific gestational age provide reproducible measurements, probably due to the high resolution of MR imaging and adherence to the true radiologic planes. Normal values for brain MR imaging could provide valuable reference information for assessing brain development, thus being an important tool in the decision-making process of both clinicians and parents.
ABBREVIATIONS:
- GA
- gestational age
- ICC
- intraclass correlation coefficient
- SAS
- subarachnoid space
- US
- ultrasound
The subarachnoid space (SAS) is located between the arachnoid membrane and the pia mater. Trabecular delicate connective tissue and intercommunicating channels containing CSF fill this space.1⇓⇓-4 Normally, the cavity is small. An enlarged cavity is associated with CNS malformations and syndromes, including macrocephaly, communicating hydrocephalus, brain atrophy, and benign enlargement of the SASs.2⇓-4 A normal-sized SAS reflects normal brain development with intact production and absorption of CSF. Assessment of macrocephaly resulting from macrocrania, hydrocephalus, or SAS abnormality5,6 is based on the occipitofrontal circumference and defined as a head circumference of 2 SDs above the mean or the 98th percentile for gestational age (GA).7 Evaluation of head circumference is also important for indicating the need for a cesarean delivery when the increased head circumference may impair vaginal delivery.8 Previous studies reported measurements of the SAS in neonates, infants, and children, using different imaging methods such as ultrasound (US),9⇓⇓⇓⇓-14 CT,15⇓-17 and MR imaging.18 Only a few studies have described the range of the normal SAS at the prenatal period, which was measured by transabdominal US,19,20 transvaginal US,9,21 and in only one study by MR imging.22
There are some technical limitations for the US examinations. Pilu et al20 reported that after 29 weeks of pregnancy, the Sylvian cistern could not be detected as a fluid-filled space; after 30–32 weeks, a decreased size of the fetal cisterns and the increased calcification of the fetal calvaria make it difficult to precisely evaluate the SAS.18,20 Transabdominal US is associated with technical difficulties in obtaining the coronal planes. Corbacioglu Esmer et al9 described the normal SAS value of 154 fetuses, though it was possible to evaluate the sinocortical width in only 88% of fetuses and the anterior craniocortical width in only in 78% of fetuses. Malinger et al21 reported a better ability to evaluate the SAS using transvaginal US and concluded that dilation of the SAS alerts obstetricians to a possible intracranial pathology requiring further investigation. Later, they described a limited measurement accuracy of the head circumference of prenatal US and demonstrated an inconsistency between prenatal and postnatal head circumferences.19 Yaniv et al23 reported discrepancy in fetal head biometry between US and MR imaging performed in fetuses with suspected microcephalus. These reports are consistent with the known advantages and disadvantages of the US compared with the MR imaging examination of the fetal brain.23 To the best of our knowledge, a wide-scale evaluation of the normal measurements of the SAS is still unavailable. Therefore, the purpose of this study was to establish normal values of the SAS in the fetal brain measured using MR imaging during 28–37 gestational weeks.
MATERIALS AND METHODS
Research Design and Subjects
A cross-sectional study based on a retrospective assessment of randomly selected brain MR images of apparently healthy fetuses obtained at 28–37 weeks of pregnancy was performed. All scans were obtained between 2012 and 2020 at Sheba Medical Center, a large tertiary referral, university-affiliated medical center. Demographic data were collected from mothers’ medical records. Only good-quality images in terms of alignment, sharpness, and well-defined planes were included.
Approximately 20 scans were selected for each week of pregnancy. GA at MR imaging was calculated from the last menstruation and as corrected by the crown-rump length measured on an US performed in the first trimester. Women with multiple pregnancy and cases with intracranial pathologic findings at MR imaging that may indicate a CNS abnormality were excluded from the study. Fetuses with isolated mild extracranial anomalies, maternal cytomegalovirus infection without evidence of fetal involvement, and healthy fetuses with a maternal history of anomalies in previous gestations were included, as was acceptable in similar studies.24,25 For fetuses that underwent multiple MR imaging, only 1 scan was included.
MR Imaging Technique
Fetal brain MR images were obtained using a 1.5T system (Optima MR450w with GEM Suite; GE Healthcare). Examination protocol consisted of single-shot fast spin-echo T2-weighted images in 3 orthogonal planes. T1-weighted fast-spoiled gradient-echo sequences in the axial plane using a half-Fourier technique (number of excitations = 0.53) were performed with the following parameters: section thickness of 3 mm, no gap, flexible coil (8-channel cardiac coil). The FOV was determined by the size of the fetal head with a range of 240 × 240 mm to 300 × 300 mm; acquisition time was between 40 and 45 seconds with matrix = 320/224, TE = 90 ms, TR = 1298 ms, pixel bandwidth = 122 Hz/pixel; specific absorption rate values = 1.1–1.7 W/kg. DWI sequence and the calculated ADC map were included.25,26
Measurements
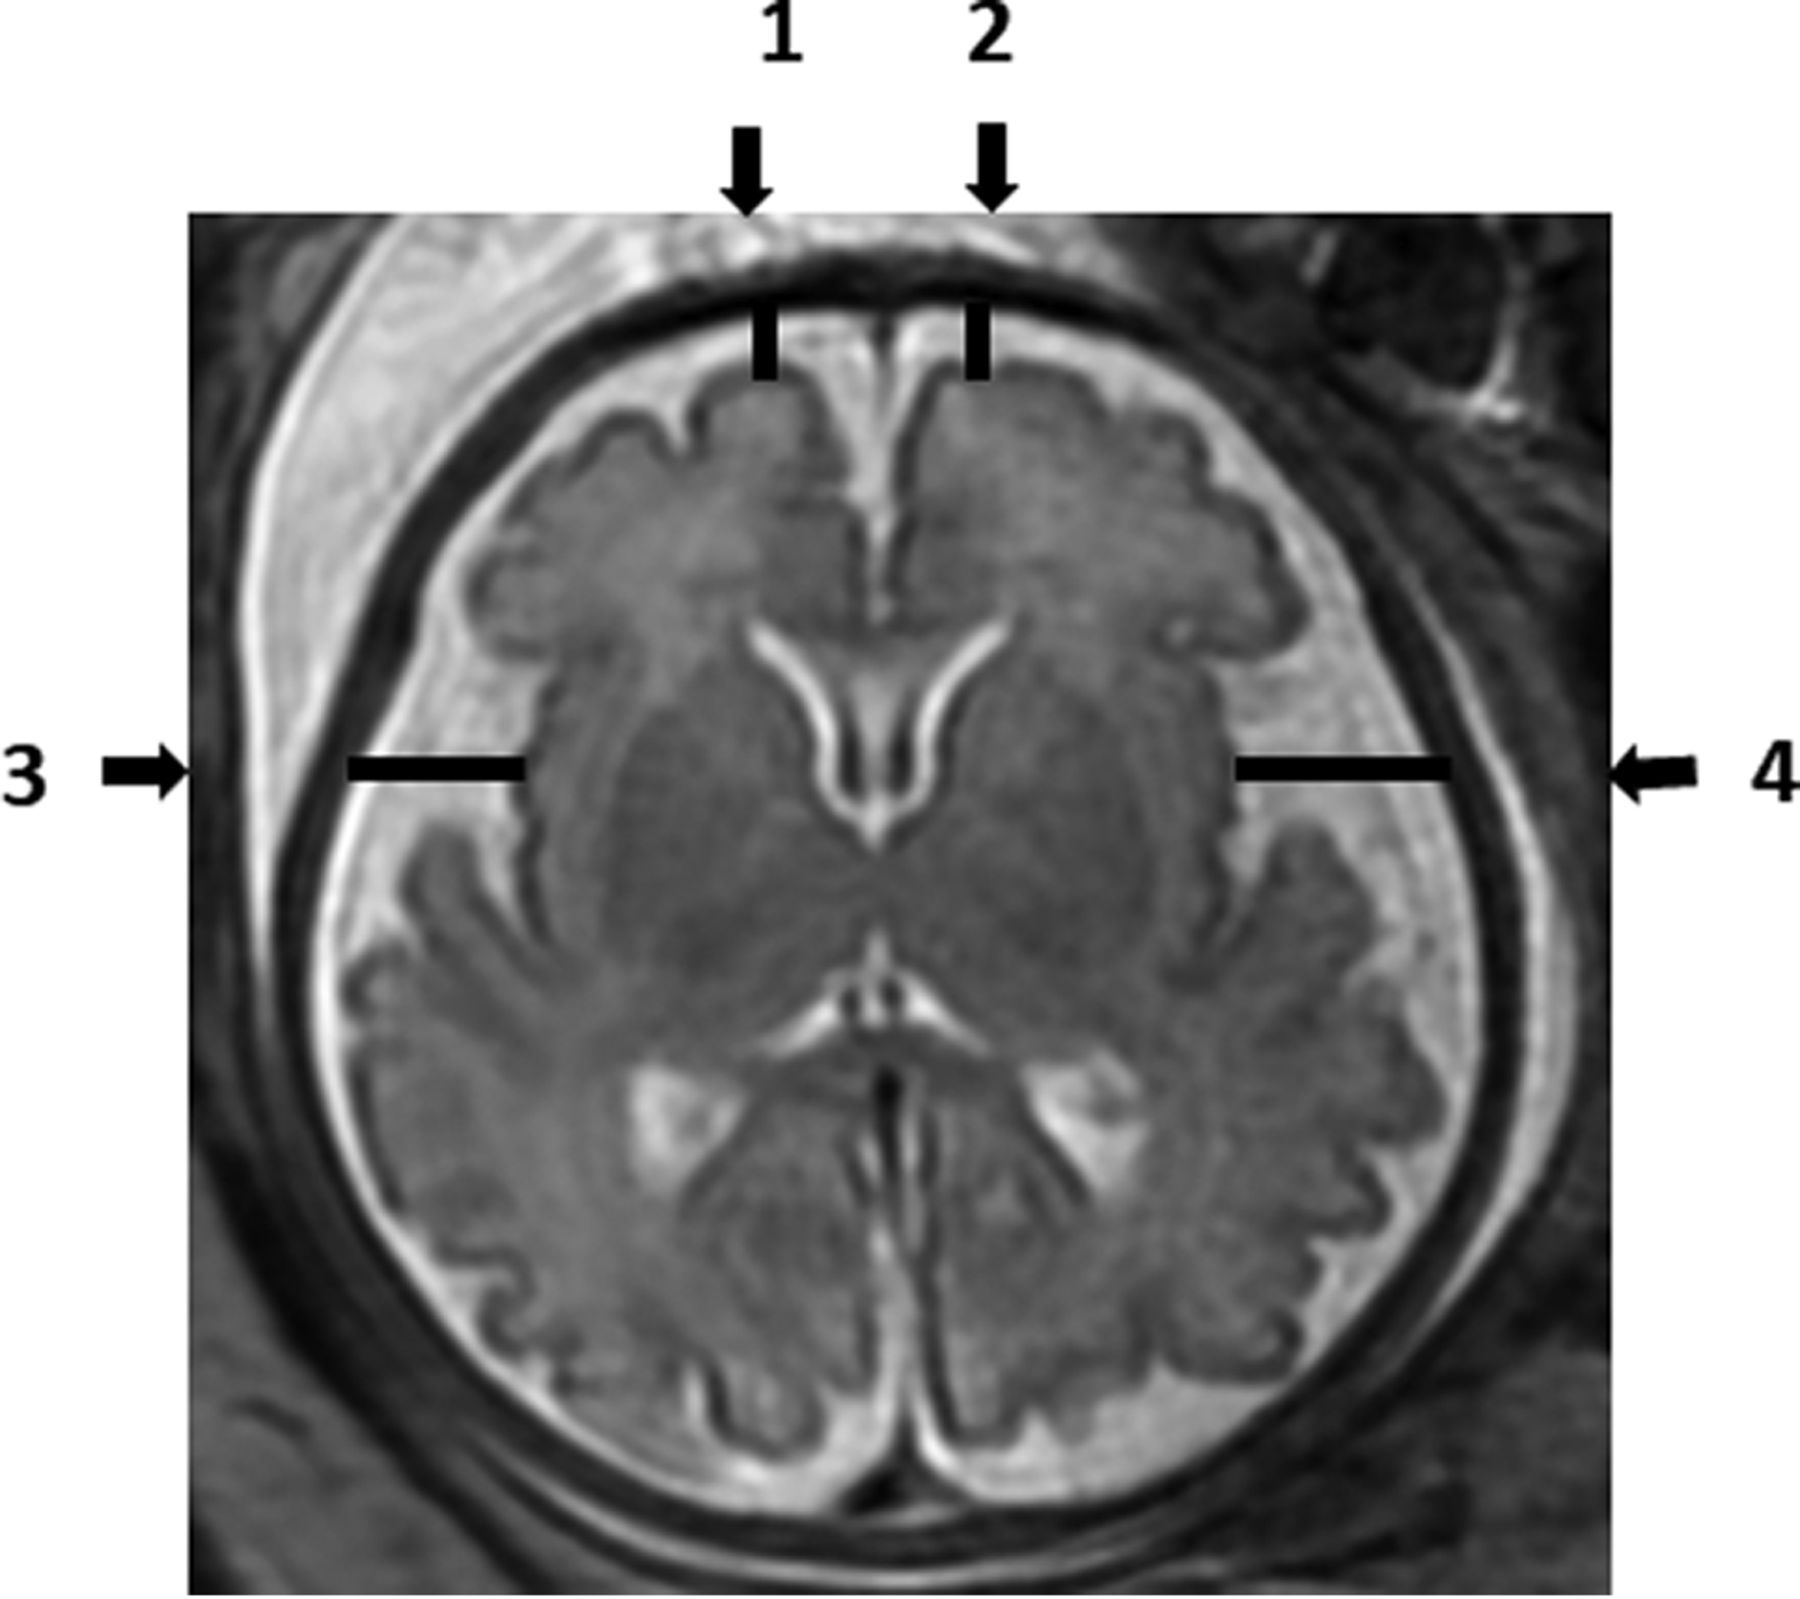
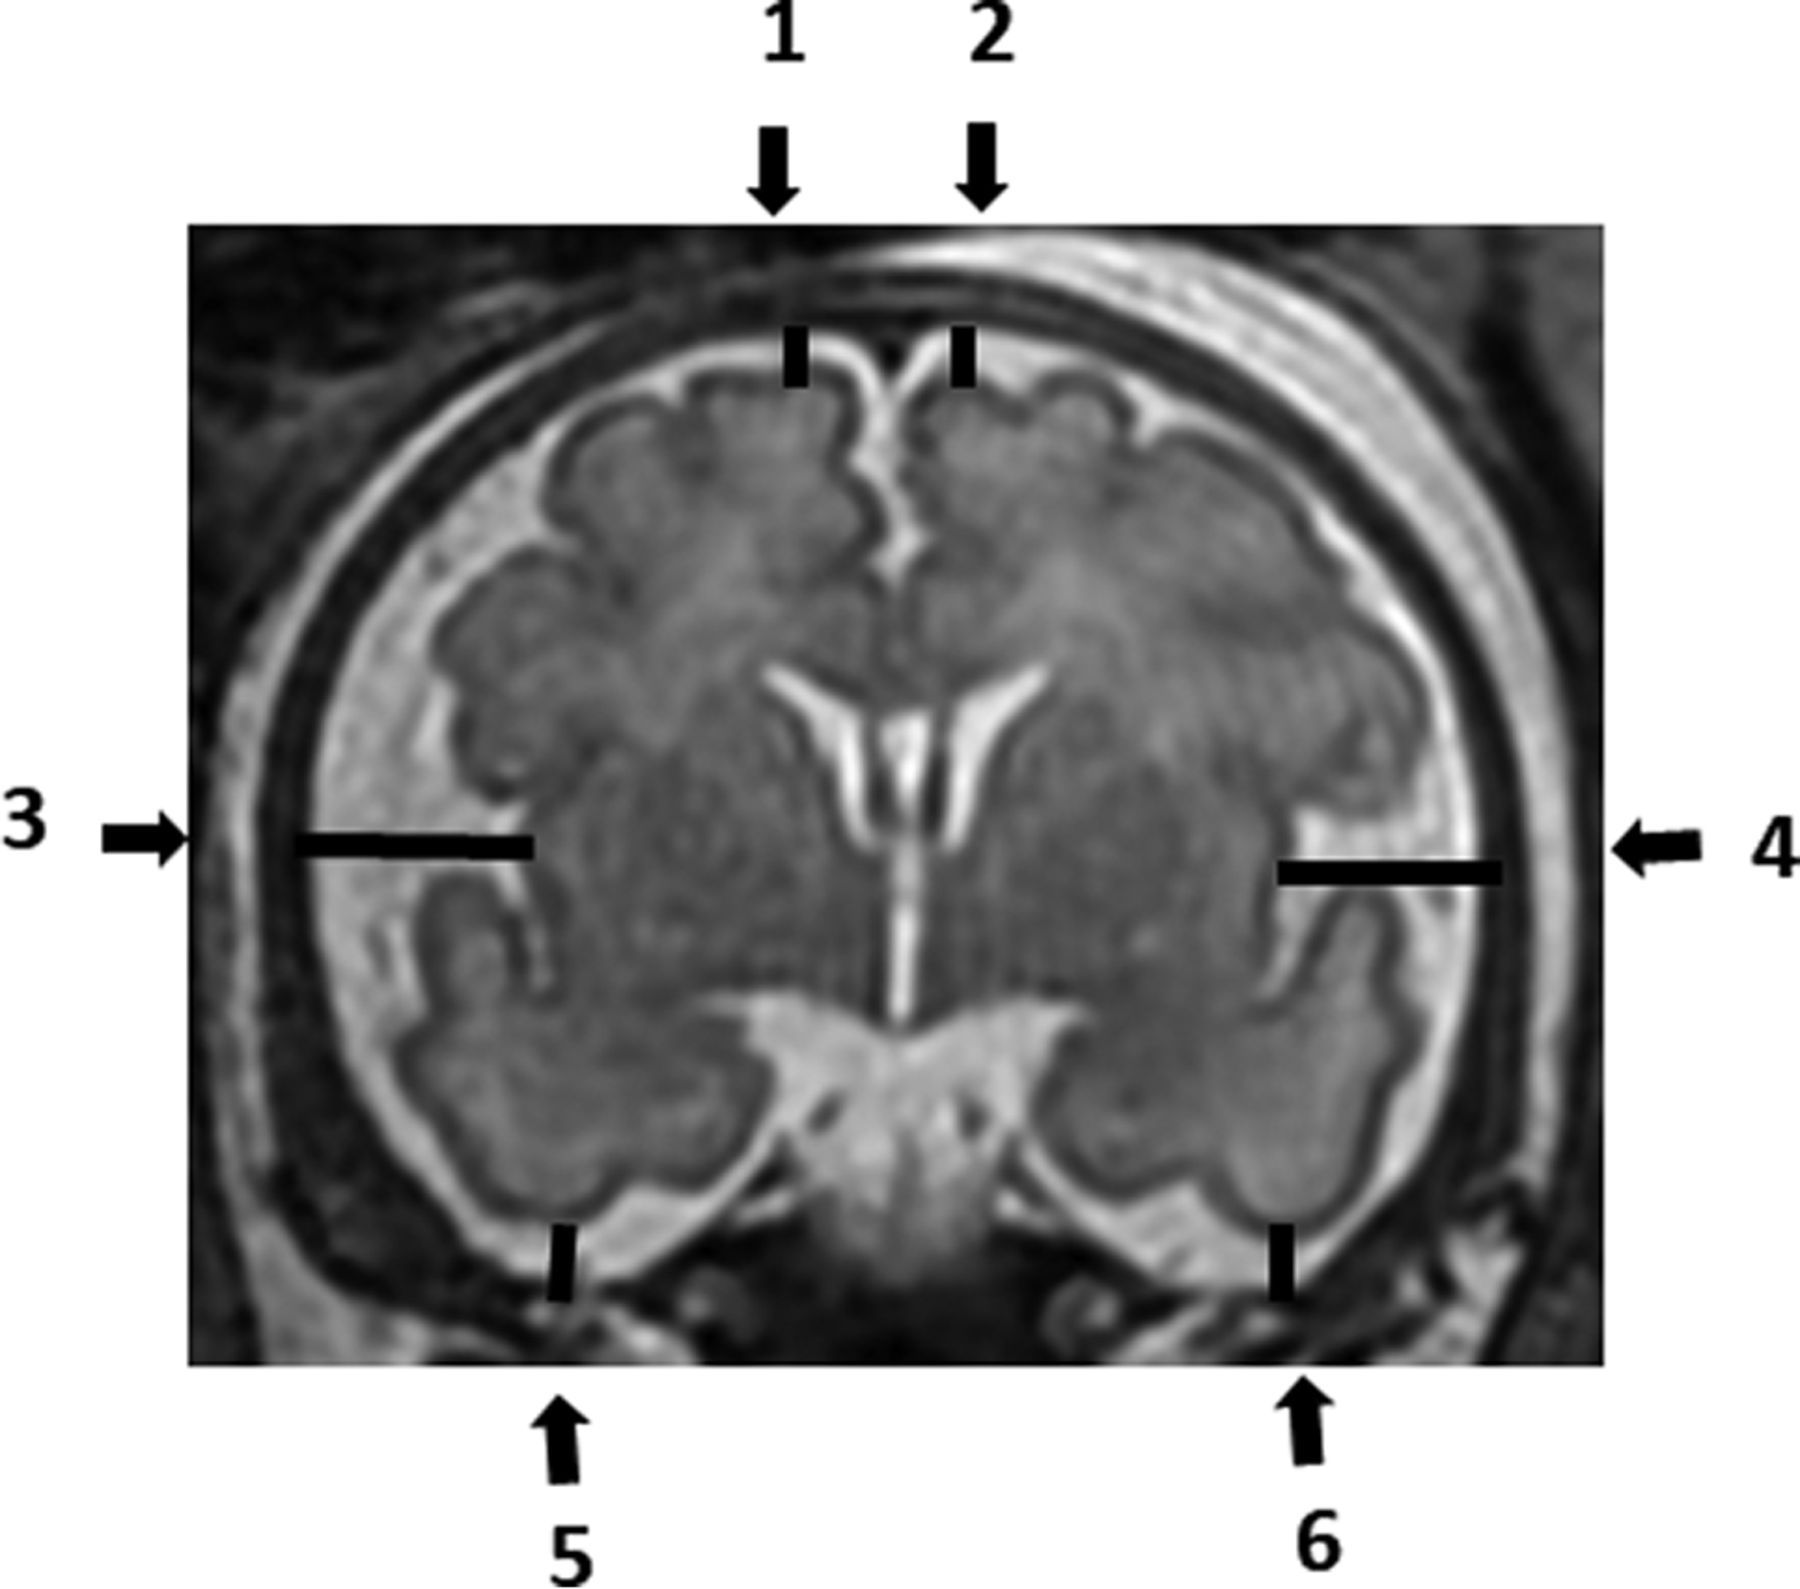
Each MR imaging examination was routinely read by 2 expert physicians to detect any abnormality. Measurements of the SAS size, which was identified by a high signal (white color) at T2-weighted imaging, were analyzed manually by a single reader (A.W.) on the PACS reading workstation. Measurements were recorded in 2D slices. The SAS was measured in millimeters, in 4 locations of the axial section (Fig 1), and in 6 locations of the coronal section (Fig 2). All measurements were obtained at the level of midinsula from the cortex to the internal margin of the cranium as shown in Figs 1 and 2: axial section - right frontal gyrus, left frontal gyrus, right insula gyrus, left insula gyrus; coronal section - right frontal gyrus, left frontal gyrus, right insula gyrus, left insula gyrus, right inferior temporal gyrus, and left inferior temporal gyrus.

Axial T2-weighted fetal brain image demonstrating the measurements of the subarachnoid space: 1) Right frontal gyrus. 2) Left frontal gyrus. 3) Right insula gyrus. 4) Left insula gyrus.

Coronal T2-weighted fetal brain image demonstrating the measurements of the subarachnoid space: 1) Right frontal gyrus. 2) Left frontal gyrus. 3) Right insula gyrus. 4) Left insula gyrus. 5) Right inferior temporal gyrus. 6) Left inferior temporal gyrus.
For the evaluation of interobserver agreement, 40 random fetuses (3–4 cases per each gestational week) were remeasured by another operator (T.W.).
A previous study showed that the SAS was not associated with fetal sex.9 Therefore, fetuses whose sex could not be determined were also included in the study.
Statistical Methods
The intraclass correlation coefficient (ICC) was used to evaluate the intraobserver and interobserver agreement. Intraclass correlation values were considered according to previously published threshold values. Intraclass correlation values of <0.5, between 0.5 and 0.75, between 0.75 and 0.9, and >0.90 were considered poor, moderate, good, and excellent reliability, respectively.27 A histogram and a quantile-quantile plot were applied to define the distribution of each SAS measurement. Measurement percentiles were generated using the Generalized Additive Model for Location, Scale, and Shape. Models for normal or log-normal distributions with cubic spline smoothing were built. The paired samples t test and Mann-Whitney test were used to compare the left and right sides. All statistical analyses were performed with R statistical and computing software (Version 4.1.0, 2021; http://www.r-project.org/).
Ethics Approval
The study was approved by the institutional review board. Informed consent was waived because of the retrospective nature of the study.
RESULTS
Two hundred fourteen fetuses who had met the inclusion criteria were measured; 101 fetuses were male, 70 were female, and for 43 fetuses, sex was not recorded. The mean maternal age was 31.2 (SD, 5.4) years. The number of fetuses analyzed in each gestational week ranged between 19 and 26 (Online Supplemental Data).
Forty random fetuses were remeasured to evaluate the intra- and interobserver agreement. Overall, good intra- and interobserver agreement was observed. Excellent, good, and moderate intraobserver agreement was observed in 4, 5, and 1 measurement, respectively. Similarly, excellent, good, and moderate interobserver agreement was observed in 2, 6, and 2 measurements, respectively. ICC values are presented in the Table.
Intraobserver and interobserver agreement
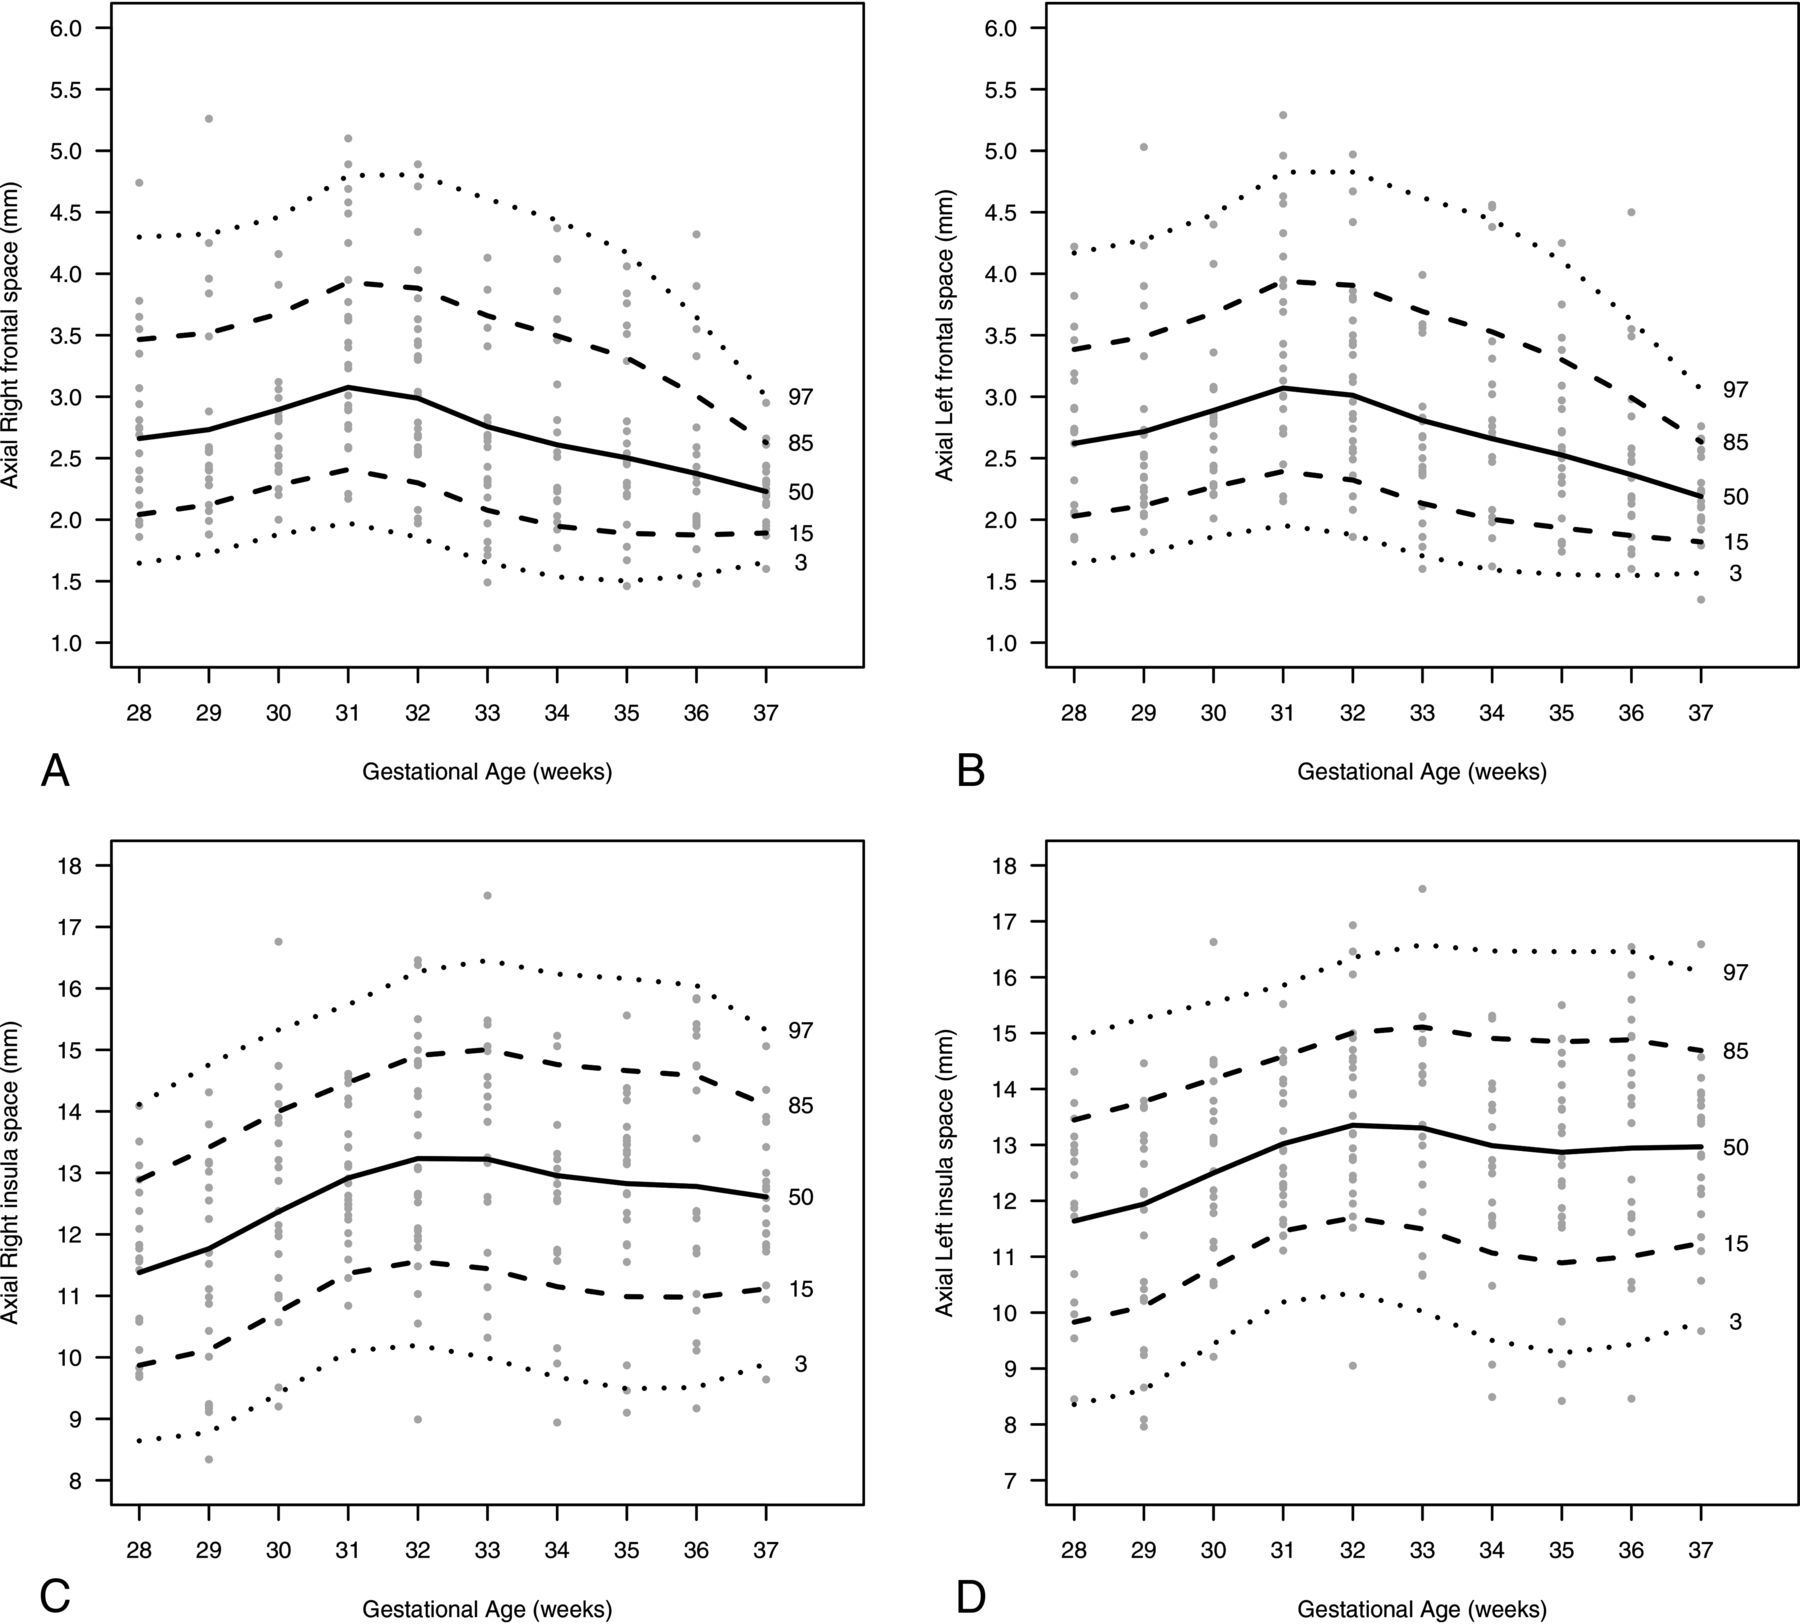
The fetuses’ measurements were used to evaluate the SAS percentiles. Percentiles according to GA are detailed in the Online Supplemental Data, while the 3rd, 15th, 50th, 85th, and 97th percentiles are summarized in Online Supplemental Data and presented in Figs 3 and 4.

A nomogram presenting the SAS size (millimeters) in the axial plane according to the 3rd, 15th, 50th, 85th, 97th percentiles and GA (weeks). A, Right frontal. B, Left frontal. C, Right insula; D, Left insula.

A nomogram presenting the SAS size (millimeters) in the coronal plane according to 3rd, 15th, 50th, 85th, 97th percentiles, and GA (weeks): A, Right frontal. B, Left frontal. C, Right insula, D, Left insula. E, Right inferior temporal. F, Left inferior temporal.
Figure 3 shows an increase in the axial left and right frontal space up to a GA of 31 weeks, with a decrease at a higher GA. Figure 4 demonstrates measurements of the coronal left and right insula, which reached the highest values at 31 weeks of pregnancy and sharply decreased at higher GAs. Measurements of the right and left insula in both axial and coronal views showed a small increase at 32 weeks of pregnancy but can be considered constant in all GAs analyzed.
There were no significant differences between left- and right-sided measurements in the axial section of the frontal location (P = .893) as well as the coronal section of the insula (P = .610) and inferior temporal space (P = .975). Nonclinical-but-statistically significant differences were observed in axial section at the insula (mean difference = 0.14 mm, P = .007) and in the coronal section at the frontal location (mean difference = 0.05 mm, P = .002).
DISCUSSION
MR imaging is considered the most exact noninvasive technique to assess structures of the developing brains of fetuses.28,29 A systematic review revealed that MR imaging confirmed US-positive findings in 65.4% of the fetuses and provided additional information for about 22.1% of the fetuses. MR imaging gave additional information that changed the clinical management in 30% of fetuses. The review also reported a sensitivity of 97% (95% CI, 95%–98%) and specificity of 70% (95% CI, 58%–81%) in the MR images.30 The ability of MR imaging to detect brain abnormalities that had not been found during US examinations increases the use of MR imaging. The ability of MR imaging to accurately demonstrate the SAS measurements makes it essential to widely determine the normal values of the SAS.
To date, only Watanabe et al22 reported an MR imaging evaluation of the healthy fetal SAS in 2005. The data by Watanabe et al on SAS MR imaging measurements were published more than 15 years ago, and since then, MR imaging technology has evolved to higher resolutions. Moreover, Watanabe et al evaluated the SAS measurement at 3 locations only (frontal, parietal, and cisterna magna). Therefore, there are limited data on the normal size of the SAS, and most of the previous research was based on US examinations. In MR imaging, T2-weighted images provide an accurate demonstration of the CSF within the SAS, which enables more precise measurements.22 Hence, the current study aimed to define MR imaging–derived measurements of the SAS in fetuses with apparently normal brains, in an attempt to provide normal valuable reference data for the SAS during the pregnancy.
In an attempt to compare available literature, we found that MR imaging has provided similar data for SAS measurements and a good agreement with previously published data.22 As mentioned above, the previous study used 3 reference areas only (frontal SAS in an axial scan, parietal SAS in an axial scan, and the cisterna magna in a sagittal scan), while the current study uses 10 well-demarcated anatomic measurements.22
The distribution of CSF across the brain is uneven; therefore, a measurement of 10 well-established anatomic points enables a precise assessment of brain development. The 10 locations for measurements enable overcoming artifacts caused by movement and better assessment of the SAS.
US examination is a real-time, safe exploration and has been a low-cost means of diagnosis for many years. The image quality of the US is operator-dependent and can be hampered by maternal obesity, decreased amniotic fluid, fetal positioning, and calvarial ossification. In addition, its relative lack of diagnostic specificity usually requires MR imaging detection of US abnormalities.31 Transabdominal and transvaginal US depict the SAS measurements in 2 axial sections only (sinocortical and craniocortical width).9,21 The use of MR imaging for evaluation of the fetal brain, especially for fetuses with suspected abnormalities on US, provides an additional accurate measurement of SAS dimensions and calls for a standardized nomenclature of a normal-width fetal SAS. Measurements of the SAS are important parameters to evaluate possible CNS abnormalities. The measurements of the SAS are independent of laterality, as previously described.9,21,22
Our study has several limitations. First, it includes a retrospective random sample of MR images obtained in a single medical center. However, this is a tertiary referral, university-affiliated medical center that performs a large volume of MR images each year. Second, intraobserver and interobserver changes may have an impact on study results. Therefore, intraobserver and interobserver agreement have been evaluated before the nomograms were built. Third, we could not evaluate the development of the children to exclude those with impaired development. Hence, we referred to the study population as apparently healthy. Fourth, because our medical center is a referral center, usually only a small percentage of the women who underwent MR imaging at our medical center also give birth there. Therefore, of the 214 studied fetuses, only 72 (33.6%) were born at our medical center, and almost all neonates were considered healthy at birth (5-minute Apgar, ≥8, 98.6%; birth at ≥37 weeks, 87.5%; normal length of hospitalization, 93.1%; emergency cesarean delivery, 0%). Fifth, because fetal brain MR images are usually obtained at 28+ weeks of pregnancy, only a few scans at <28 weeks of pregnancy were available; thus, normal values could not be achieved for this GA.
CONCLUSIONS
The increased use of MR imaging for the diagnosis of fetal brain pathologies requires a standardization of the normal anatomic development. Using normal values may help to make uniform the way the physicians read the scans. This work provides percentiles of 10 SAS anatomic measurements of apparently healthy fetal brains according to the GA.
Footnotes
E. Kotorza and T. Ziv-Baran contributed equally to this work.
Disclosure forms provided by the authors are available with the full text and PDF of this article at www.ajnr.org.
References
- Received February 11, 2023.
- Accepted after revision April 4, 2023.
- © 2023 by American Journal of Neuroradiology


Jump to section
Related Articles
Cited By...
- No citing articles found.