
Abstract
BACKGROUND AND PURPOSE: With the utility of hybrid τ PET/MR imaging in the screening, diagnosis, and follow-up of individuals with neurodegenerative diseases, we investigated whether deep learning techniques can be used in enhancing ultra-low-dose [18F]-PI-2620 τ PET/MR images to produce diagnostic-quality images.
MATERIALS AND METHODS: Forty-four healthy aging participants and patients with neurodegenerative diseases were recruited for this study, and [18F]-PI-2620 τ PET/MR data were simultaneously acquired. A generative adversarial network was trained to enhance ultra-low-dose τ images, which were reconstructed from a random sampling of 1/20 (approximately 5% of original count level) of the original full-dose data. MR images were also used as additional input channels. Region-based analyses as well as a reader study were conducted to assess the image quality of the enhanced images compared with their full-dose counterparts.
RESULTS: The enhanced ultra-low-dose τ images showed apparent noise reduction compared with the ultra-low-dose images. The regional standard uptake value ratios showed that while, in general, there is an underestimation for both image types, especially in regions with higher uptake, when focusing on the healthy-but-amyloid-positive population (with relatively lower τ uptake), this bias was reduced in the enhanced ultra-low-dose images. The radiotracer uptake patterns in the enhanced images were read accurately compared with their full-dose counterparts.
CONCLUSIONS: The clinical readings of deep learning–enhanced ultra-low-dose τ PET images were consistent with those performed with full-dose imaging, suggesting the possibility of reducing the dose and enabling more frequent examinations for dementia monitoring.
ABBREVIATIONS:
- AC1
- Gwet's agreement coefficient 1
- AD
- Alzheimer's disease
- CNN
- convolutional neural network
- GAN
- generative adversarial network
- SUVR
- standard uptake value ratio
More than 6 million individuals are living with Alzheimer's disease (AD) in the United States. By 2060, this number is projected to increase to nearly 14 million (https://www.cdc.gov/aging/aginginfo/alzheimers.htm). This neurodegenerative disorder leads to progressive, irreversible loss of memory and behavioral function.1 Pathologic features of AD include accumulation of amyloid β into extracellular plaques and hyperphosphorylated τ into intracellular neurofibrillary tangles, which can be identified with PET imaging.2 Abnormalities of τ mediate amyloid β–induced toxicity3 and are a close proxy of clinical status.4 Furthermore, because pathologic processes of AD begin decades before mild cognitive impairment and dementia stages, in vivo measurements of amyloid β plaques and tangles could enable early detection and an opportunity for intervention.5 Along these lines, recent work has shown that subtle elevations in τ PET can be detected in clinically healthy older adults and are predictive of subsequent decline.6
Advanced modalities such as simultaneous PET/MR imaging provide complementary morphologic and functional information with perfect spatiotemporal registration of the 2 imaging data sets,7 all of which can facilitate the diagnosis and monitoring of dementia.8,9 However, radiation exposure related to the radiotracers administered to imaging subjects presents barriers to screening, clinical follow-up, and research participation due to radiation dose thresholds. Therefore, radiotracer dose reductions have been a target for intervention for many researchers.
Deep learning methods such as convolutional neural networks (CNNs) have been used for image identification,10 generation,11,12 segmentation,13 and MR imaging–based attenuation correction.14,15 CNNs that incorporate spatially correlated MR imaging and PET information to produce standard-quality PET images from low-dose PET acquisitions (though most such studies were conducted on [18F]-fludeoxyglucose scans) have been implemented.16⇓⇓⇓⇓-21 For example, deep CNNs can reduce the radiotracer dose by at least 100-fold for [18F]-florbetaben, an in vivo biomarker of amyloid plaque buildup,22 and enhancement of both simulated (undersampled in PET/MR imaging reconstruction) and true (injected with ultra-low-dose) ultra-low-dose images resulted in the production of diagnostic-quality images comparable with standard dose images.23
Here, we investigate whether similar techniques in deep learning can be used to enhance ultra-low-dose [18F]-PI-2620 τ2 PET/MR images to produce diagnostic-quality images. Compared with amyloid PET and plasma phosphorylated τ biomarkers,24,25 τ PET has its strength in discriminating AD from other neurodegenerative disease26 and can aid in regional cerebral τ analysis for the identification of various tauopathies. With the uptake of a τ tracer being more focal and having a weaker signal than amyloid PET images in general, we have found that directly applying the CNN in our previous work carries over data bias from the amyloid PET training data set.27 Therefore, in this work, we implemented a generative adversarial network (GAN) structure28 in addition to training the ultra-low-dose τ enhancement CNN from scratch. In addition, in this article, we have focused on aging participants as well as those with a variety of neurodegenerative diseases. Examining asymptomatic/early dementia populations, including preclinical AD and mild cognitive impairment, is increasingly important for dementia studies, but these groups are difficult to image because the PET signal can be lower and restricted to the medial temporal lobe compared with those with AD dementia.29,30 Patients who are amyloid-positive and mild τ-positive who are most likely in an asymptomatic or mild cognitive impairment stage may also require more frequent follow-up scans to monitor for disease progression.
Unlike the use of PET for cancer monitoring, patients with dementia may have much longer periods than patients with cancer in which to accrue the negative effects of medical radiation, especially if the use of image monitoring expands, beginning in the asymptomatic or minimally symptomatic stages. Reducing the PET tracer dose can lead to safer scans and increase the utility of hybrid PET/MR imaging for screening, clinical diagnoses, and longitudinal studies (improved follow-up adherence). With the increasing availability of data and research participation, researchers can also better understand the pathogenesis and identify targets for pharmacotherapy. At the population level, reducing dosing has the potential to decrease health care costs to individual patients as well as research and health care institutions.
MATERIALS AND METHODS
Forty-four total participants were recruited for this study, approved by the Stanford University institutional review board. Written informed consent was obtained from all participants or an authorized surrogate decision-maker. Older healthy controls were recruited through the Stanford Aging and Memory Study (SAMS; https://www.alzheimers.gov/clinical-trials/stanford-memory-and-aging-study). Patients with cognitive impairment (either a clinical diagnosis of mild cognitive impairment or AD dementia) and semantic-variant primary-progressive aphasia were recruited through the Stanford Alzheimer Disease Research Center or the Stanford Center for Memory Disorders. Demographics of the patient group, including their clinical diagnoses (determined by clinical consensus of a panel of neurologists and neuropsychologists), are shown in Table 1. In particular, 7 participants from the healthy controls were amyloid-positive as determined by CSF (details in Trelle et al31).
Demographics and clinical indications of study population
PET/MR Imaging Data Acquisition
T1-weighted and T2-FLAIR MR imaging data and τ PET data were simultaneously acquired on an integrated 3T PET/MR imaging scanner (Signa; GE Healthcare); 221 [SD, 61] MBq of the τ radiotracer [18F]-PI-2620 was injected, and imaging was performed between 60 and 90 minutes after injection. The raw list-mode PET data were reconstructed for the full-dose ground truth image and were also randomly undersampled by a factor of 20 (approximately 5% of original count level) and then reconstructed to produce an ultra-low-dose PET image. Previous studies have suggested that this method of simulation of ultra-low-dose imaging is a good representation of the true injected ultra-lowdose.23 TOF ordered subsets expectation maximization, with 2 iterations and 28 subsets and accounting for randoms, scatter, dead-time, and attenuation, was used for all PET image reconstructions. MR imaging attenuation correction was performed using the vendor's zero TE–based method, and a 4-mm postreconstruction Gaussian filter was used for all reconstructions.
Image Preprocessing
To account for any positional offset of the patient during different acquisitions, we coregistered MR images to the PET images using the FMRIB Linear Image Registration Tool (FLIRT; http://www.fmrib.ox.ac.uk/fsl/fslwiki/FLIRT),32 with 6 df and the correlation ratio as the cost function. All images were resliced to the dimensions of the acquired PET volumes: eighty-nine 2.78-mm-thick slices with 256-by-256 1.17 × 1.17 mm2 pixels. A head mask was made from the T1-weighted image through intensity thresholding and hole filling and applied to the PET and MR images. The voxel intensities of each volume were normalized using its z score (mean divided by SD within a FreeSurfer-based brain mask [http://surfer.nmr.mgh.harvard.edu] derived from the T1-weighted images) and used as inputs to the CNN.
CNN Implementation
The ultra-low-dose τ network was trained using a GAN structure28 with 3916 input slices (44 data sets with 89 slices each). The generator portion of the GAN used the proposed structure in Chen et al,22,23 which included an encoder-decoder CNN with the U-Net33 structure (Fig 1, upper image) where the inputs were the concatenation of multicontrast MR images (T1 and T2 FLAIR-weighted) and the ultra-low-dose PET image. The full-dose PET image was treated as the ground truth and the network was trained through residual learning.11 Briefly, the encoder portion is composed of layers that perform 2D convolutions (using 3 × 3 filters) on input 256-by-256 transverse slices, batch normalization, and rectified linear unit activation operations. We used 2-by-2 max pooling to reduce the dimensionality of the data. In the decoder portion, the data in the encoder layers are concatenated with those in the decoder layers. Linear interpolation is performed to restore the data to its original dimensions. In addition, a discriminator (Fig 1, lower image) was added to distinguish whether the output image is realistic or not. The discriminator portion of the GAN consists of 5 convolution blocks, which are composed of convolution layers with 4 × 4 filters and 2 × 2 stride, batch normalization, and leaky rectified linear activation with the slope of 0.2. A convolution layer with a 3 × 3 filter is added to map the features to 1 channel as the output. The final objective for the encoder-decoder network is the combination of a pixel-wise L1 loss and an adversarial loss:
 where x is the input images, y is the standard dose image, and
  is the enhanced image. The GAN was trained with an initial learning rate of 0.0001 and a batch size of 16 over 50 epochs. The training, validation, and testing data were split at the participant level for an approximate 7:1:2 ratio, and 5-fold cross-validation was used to employ all the data for training and testing.

A schematic of the GAN (generator network, upper image; discriminator network, lower image) used in this work and its input and output channels. The arrows denote computational operations, and the tensors are denoted by boxes, with the number of channels indicated above each box. BN indicates batch normalization; Conv, convolution; Max, maximum; ReLU, rectified linear unit; tanh, hyperbolic tangent.
Assessment of Image Quality
The reconstructed images were first visually inspected for artifacts. For each data set, the region within the brain mask was considered for voxel-based analyses. For each axial section, the image quality of the enhanced PET images and the original ultra-low-dose PET images within the brain mask were compared with the full-dose image using the peak SNR, structural similarity,34 and root mean square error. The metrics for each subject were obtained by a weighted average (by voxel number) of the slices.
Clinical Readings
The enhanced PET images, the ultra-low-dose PET image, and the full-dose PET image of each data set were anonymized, and their series numbers were randomized and then presented by series number to 3 physicians (M.E.I.K., a dual-boarded nuclear medicine and diagnostic radiology physician; S.S., a neuroradiology fellow; G.Z., a neuroradiologist) for independent reading (reading protocol for the identification of regional uptake is available in the Online Supplemental Data). Ten random full-dose PET images were also presented to the physicians to evaluate intrareader reproducibility. The consensus τ status read from the 3 reviewers on the full-dose images was treated as the ground truth. For each PET image, the physicians also assigned a subjective image-quality score on a 5-point scale: 1 = uninterpretable, 2 = poor, 3 = adequate, 4 = good, 5 = excellent. Also, image-quality scores were dichotomized into 1–2 (low) versus 3–5 (high), with the percentage of images with high scores calculated for each method. The agreement of the 3 readers was assessed using the Gwet's agreement coefficient 1 (AC1)35 on the full-dose readings, and if high agreement was found, the readings of the 3 readers were pooled for further analysis.
Region-Based Analysis
Region-based analyses were performed to assess the agreement of the tracer uptake among images. Cortical parcellations and cerebral segmentations based on the Desikan-Killiany Atlas36 were derived from FreeSurfer and analyses focused on the medial temporal lobe, comprising the entorhinal cortex and amygdala and the inferior temporal cortex. The inferior cerebellum was used as the reference region for standard uptake value ratio (SUVR) calculations for all 3 (full-dose, ultra-low-dose, and enhanced) image types. The SUVRs were compared between methods (full-dose to ultra-low-dose and full-dose to enhanced) and evaluated by Bland-Altman plots. Focus was on the healthy controls positive for amyloid, and these participants were labeled separately on the plots. The coefficient of variation (SD divided by the mean uptake) in the medial temporal lobe and the inferior temporal cortex were also calculated to assess image noise in the image types.
Statistical Analysis
For quantitative tests, paired t tests at the P = .05 level were performed to compare peak SNR, structural similarity, and root mean square error metrics between the ultra-low-dose images and their CNN-enhanced counterparts.
Pair-wise t tests were also performed to compare the values of the image-quality metrics across the different image-processing methods. The accuracy, sensitivity, and specificity were calculated for the readings of the ultra-low-dose and enhanced PET images. Symmetry tests were also performed to examine whether the readings produced an equal number of false-positives and -negatives. The agreement of the 3 readers was assessed using Gwet's AC1.35 Average image scores for each method are presented. The 95% confidence interval for the difference in the proportions of high scores was constructed and compared with a predetermined noninferiority benchmark of 15%. Tests were conducted at the P = .05 level (Bonferroni correction to account for multiple comparisons when necessary).
RESULTS
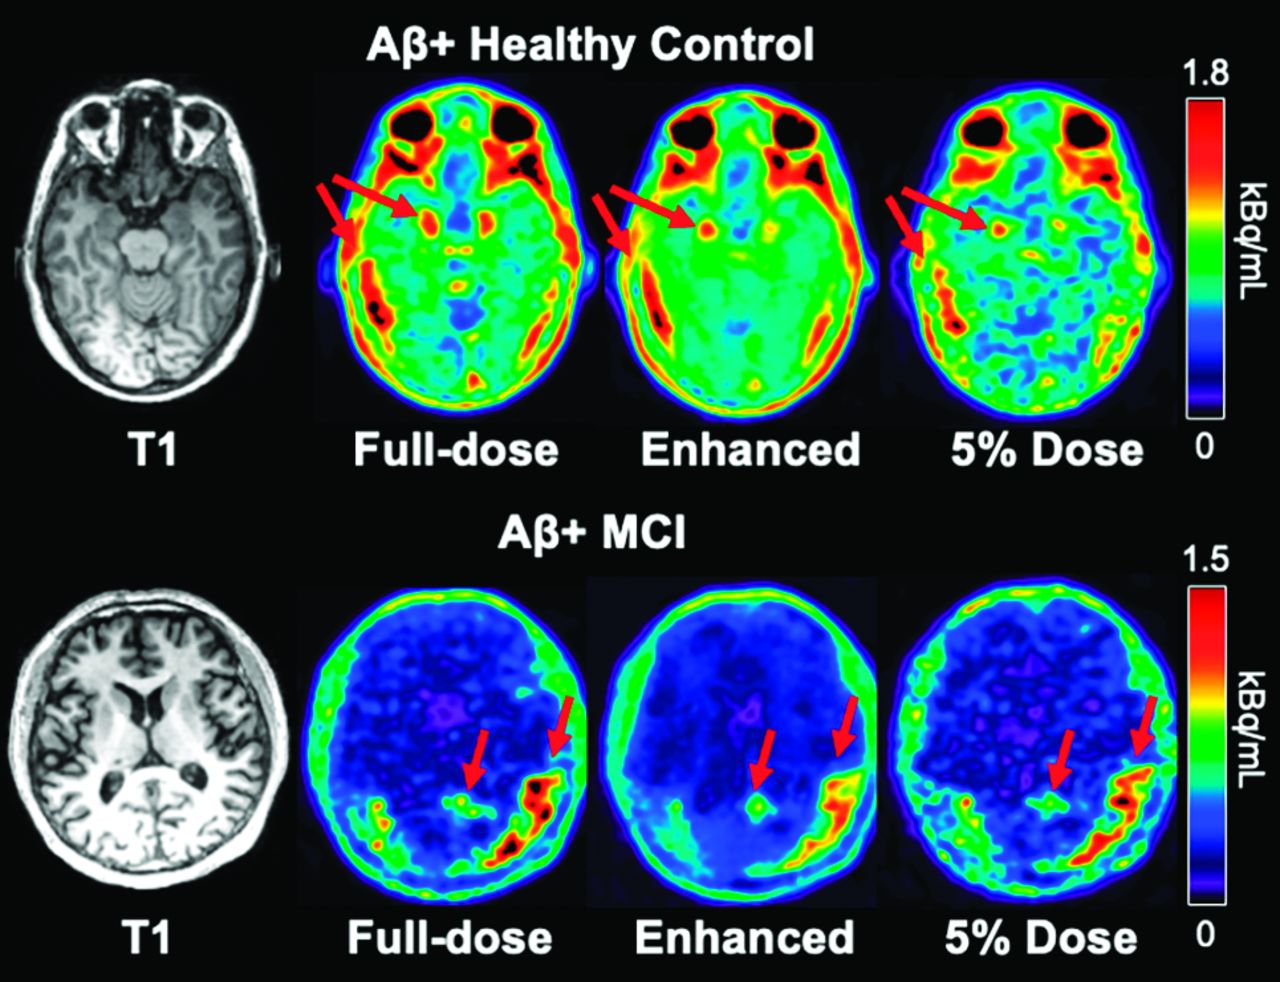
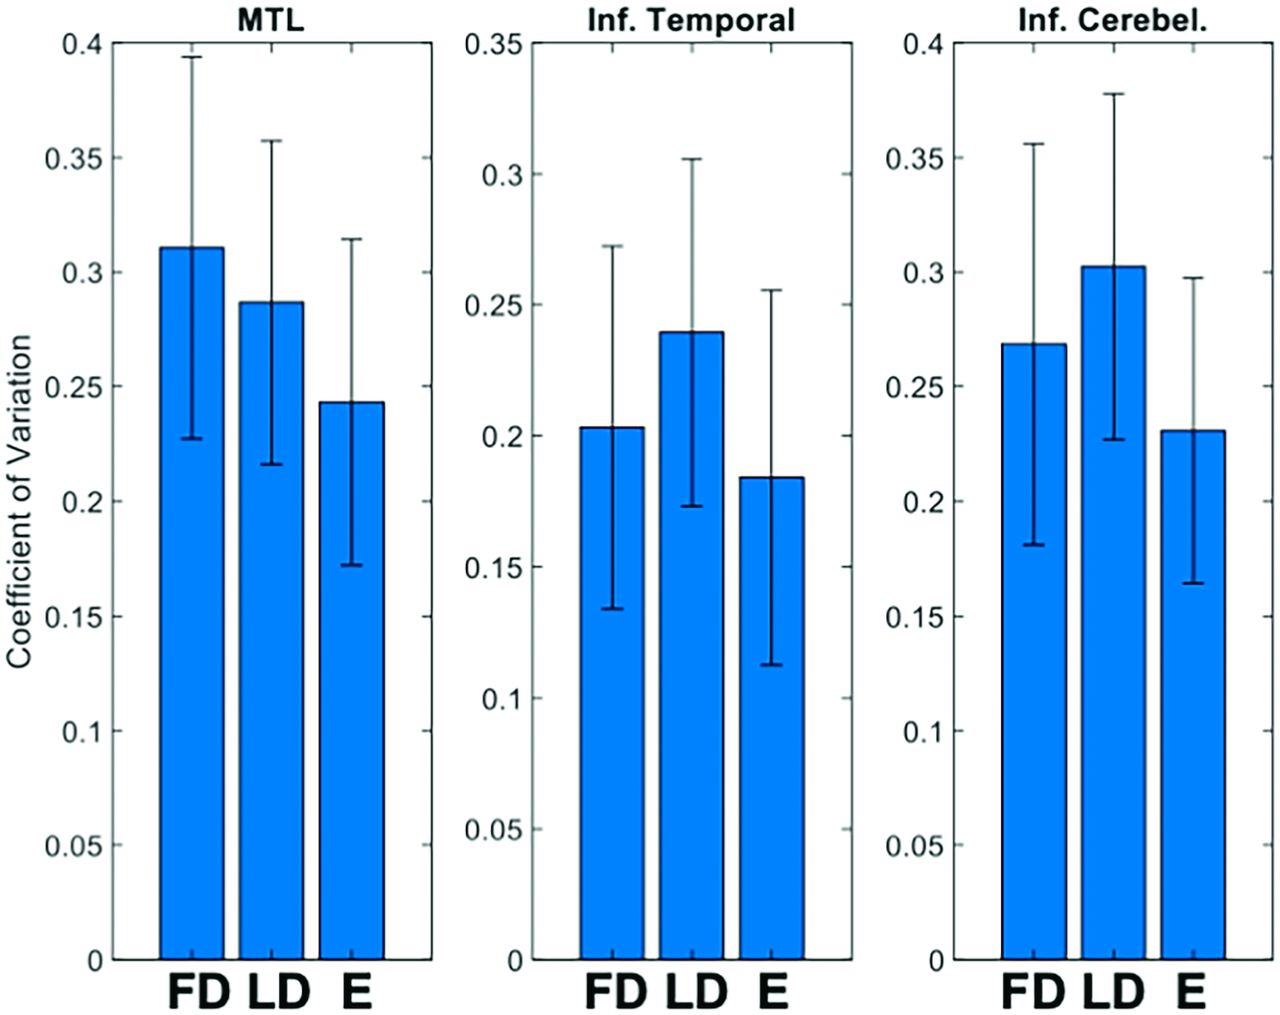
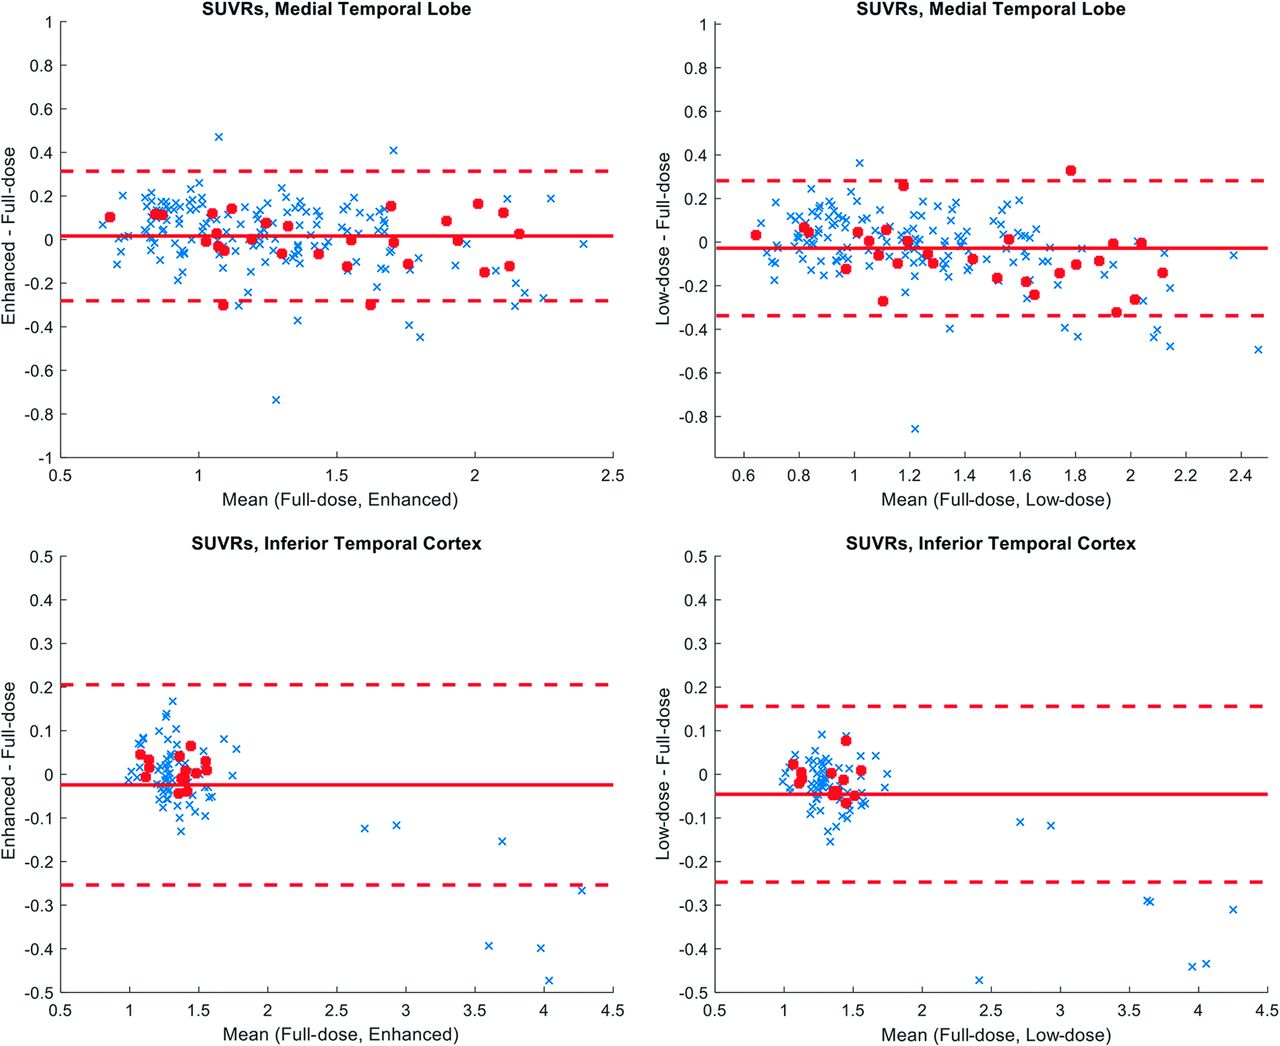
The enhanced τ images showed apparent noise reduction with smoother image texture compared with the ultra-low-dose images (Fig 2). Quantitatively, the 3 image-based metrics all improved significantly (P < .05/3, Fig 3) after enhancement of the ultra-low-dose images. The regional coefficient of variation in regional SUVRs was reduced in the enhanced image types (P < .001 for all comparisons with the enhanced images), indicating noise reduction in the images (Fig 4). The regional SUVRs showed generally low bias and variability between the full-dose images and other image types. While there is an underestimation in the SUVRs for both image types on average (influenced by regions with higher uptake, though the slight overestimation by the ultra-low-dose images contributed to a smaller coefficient of variation than that of the full-dose images) when focusing on the healthy-but-amyloid-positive population (with generally lower τ uptake), this bias was reduced (P < .025, paired t tests corrected for 2 comparisons) in the enhanced images (average SUVR difference: 0.0101 [SD, 0.0312] in the inferior cortex and −0.0014 [SD, 0.1238] in the medial temporal lobe) relative to that in the ultra-low-dose images (average SUVR difference: −0.0153 [SD, 0.0374] in the inferior cortex and −0.0566 [SD, 0.1451] in the medial temporal lobe) (Fig 5).

Representative τ PET images and their corresponding T1-weighted MR image in 2 individuals positive for amyloid. The enhanced PET image shows greatly reduced noise compared with the ultra-low-dose PET image. Arrows correspond to regions of abnormal elevated τ uptake. MCI indicates mild cognitive impairment.

Image-quality metrics comparing the ultra-low-dose PET (LD) and the ultra-low-dose enhanced PET (E) images with the ground truth full-dose PET image. PSNR indicates peak signal-to-noise ratio; SSIM, structural similarity; RMSE, root mean square error.

Mean (SD) of SUVR coefficient of variation in selected brain regions. E indicates enhanced images; FD, full-dose images; Inf. Cerebel, inferior cerebellum; MTL, medial temporal lobe; LD, ultra-low-dose image; Inf. Temporal, inferior temporal cortex

Bland-Altman plots comparing mean SUVRs in the ultra-low-dose PET and the enhanced PET with the full-dose PET images. The red dots denote healthy controls positive for amyloid, and the regions selected are the FreeSurfer labels, which make up the bilateral medial temporal lobe (entorhinal, amygdala) and the bilateral inferior temporal cortex.
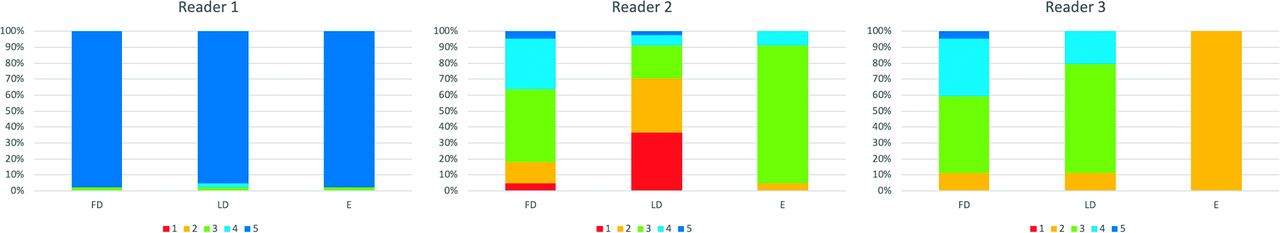
While the 3 readers have discussed and agreed to a reading protocol for the identification of regional uptake, they exhibited different preferences in reading the images based on the 5-point scale (Fig 6). However, when using the dichotomized scale, the readers showed agreement in their ratings of the 3 image types. Noninferiority tests at the predetermined threshold of −15% for subjective image quality showed that both the ultra-low-dose and enhanced images were inferior to the full-dose images.

Quality scores of different image types as rated by 3 expert readers. Image quality scores: 1, uninterpretable; 2, bad; 3, adequate; 4, good; 5, excellent. FD indicates full-dose; LD, ultra-low-dose; E, enhanced.
The intrareader reproducibility and interreader agreement was high in reading the full-dose images (Tables 2 and 3). Among image types, the readers also had high agreement in evaluating the status of τ uptake in the regions (Gwet's AC1 > 0.65, Table 1); the uptake in the ultra-low-dose and ultra-low-dose enhanced images was read accurately (accuracy >0.84 for all relevant regions, Table 2) compared with their full-dose counterparts.
Gwet's AC1 between and within readers of 10 randomly selected full-dose images on the tracer uptake in relevant brain regions and on the subjective image quality
Accuracy, sensitivity, and specificity of ultra-low-dose images and enhanced images compared with the full-dose images
DISCUSSION
In this study, we have proposed a GAN structure to produce diagnostic-quality τ PET images from input representing a simulated 5% dose PET acquisition. There are many reasons to reduce the dose for dementia PET imaging, including enabling more frequent follow-up scans (under current radiation safety levels) to monitor for disease progression, especially in individuals who are asymptomatic or in the mild cognitive impairment stage. Another value is to extend the access of advanced tracers to more rural regions that are not within current service regions for radiotracer delivery, a problem that affects up to 10% of the US population. Because τ PET images generally show reduced and focal uptake compared with other radiotracers such as amyloid and also contain more image noise, we have chosen a GAN structure for training to generate images with more similar image texture compared with those generated with only a U-Net such as in Chen et al.22 We have shown in a previous study that directly using a U-Net trained on amyloid images to generate images is inferior to using a network trained with τ images, which took the image properties of the different radiotracers into account during training.27
The generated images show that the noise in the PET images is greatly reduced through network training. The lower coefficient of variation in selected regions relevant to the participant population also reflects this finding. In addition, the peak SNR, structural similarity, and root mean square error metrics show that the generated images also resemble the full-dose images more than their ultra-low-dose counterparts.
The Bland-Altman plots showed that the ultra-low-dose and enhanced images were similar in their regional SUVR biases compared with the full-dose images (Fig 5). In general, in participants with high uptake in the inferior temporal cortex, SUVR underestimation was present compared with the values in the full-dose images. However, when we examined the healthy control population positive for amyloid, a demographic that needs close attention in tracking the participants' progression, the enhanced images showed less bias when calculating the SUVRs in regions relevant to neurodegeneration. This finding shows the potential of using deep learning–based enhancement of ultra-low-dose PET images in subjects needing more frequent PET follow-up and is a first step in translating this method to routine clinical and scientific use for these subjects.
For the reader study, the readers rated 2 aspects of each image: subjective image quality and whether the images provide clinical information related to the τ imaging. For the former, a 5-point Likert scale was used; for the latter, because there is no official rating scale established for this particular τ radiotracer, the readers evaluated whether there is increased uptake in a number of regions relevant to τ imaging.
The results from subjective image quality showed that the readers had different preferences in reading the images. In fact, the readers each had a different preference: Reader 1 was generous in assigning quality scores for all image types; reader 2 showed a preference against the ultra-low-dose images, where there was more image noise; reader 3, on the contrary, did not prefer the enhanced images where more image-smoothing occurred. However, when we examined the dichotomized scale, the ratings from all 3 readers showed that there are more full-dose images scored as “high-quality” than the other 2 image types, in which the proportion of high-quality images for the ultra-low-dose and enhanced images fell below the noninferiority threshold. This finding also highlights the challenge of deep learning enhancement of PET images that have a weak focal uptake. It is possible that 95% undersampling is too great for the current GAN to synthesize similar quality, given the number of cases to which we had access.
In reading the uptake in relevant regions, Gwet's AC1 showed intrareader agreement (reproducibility) as well as interreader agreement in the radiotracer uptake of selected regions. Most interesting, the readings of different image types across the 3 readers also showed high agreement, indicating that both the enhanced images and the ultra-low-dose images could provide uptake information, similar to the full-dose images, with slight benefit for the enhanced images. Therefore, the enhanced ultra-low-dose images provide a tool for readers who do not prefer noisy images.
This study has several limitations. Because there is no official guideline on how to read τ images and how to evaluate their image quality, we evaluated the uptake patterns on the basis of criteria agreed to by the 3 readers, using a positive/negative scale in several important ROIs. Most (31/44) of the participants in this study were healthy controls, which would contribute to an imbalance in our training data. On the other hand, healthy controls are an important focus. We have shown, in a previous study, that matching target populations in the training and testing data is important for optimal results;37 if the training data were overweighted to patients with AD, the performance of the GAN might be suboptimal in a healthy control test set. Moreover, healthy controls are increasingly becoming the focus of research studies38 and early prevention clinical trials, highlighting the value of tracking τ in at-risk healthy controls in addition to patients with AD (when cognitive decline symptoms have already manifested).
In the future, more sophisticated networks will be evaluated to better replicate the image texture of the full-dose images. More complex networks could potentially allow further dose reduction to show differences between the ultra-low-dose and the enhanced images and minimize the effects of the network for reader preference. On the other hand, we did not experiment with simpler, non-deep-learning–based methods such as image filtering and their results in noise reduction. However, from our experience in training PET-only networks (which does not provide as much morphologic information as the results indicate),22 such methods tend to produce inferior results, and we suspect that this finding would be more likely for τ because its uptake is weaker and more focal. A larger and more diverse population in the participant population for the training and testing sets would also likely improve performance. Through data-acquisition of participants with higher τ uptake or those with more advanced dementia, we could expand our analyses to regions relevant to those populations, instead of solely focusing on the 3 regions in this work. We examined only 1 dose-reduction level, which was estimated on the basis of earlier work with FDG and amyloid tracers, partially to mitigate the demands on the 3 clinical readers. The use of low-dose images with less undersampling could produce improved results, and the results could be further confirmed with actual low-dose studies and region-based validation of SUVRs between the 2 low-dose regimens.
CONCLUSIONS
The deep learning–enhanced images could be read clinically for regional uptake patterns of τ accumulation, similar to the full-dose images. With further refinements, this technique can potentially increase the utility of hybrid PET/MR imaging in clinical diagnoses and longitudinal studies.
Footnotes
This work was supported by the National Institutes of Health (P41-EB015891, R01-EB025220, R56-AG071558, K99-AG068310-01A1, R01-AG048076, R21-AG058859), the Stanford Alzheimer's Disease Research Center (P30-AG06615), the Yushan Fellow Program by the Ministry of Education (NTU-112V1015-3, R.O.C.) the National Science and Technology Council grant (110-2222-E-002-015-MY3, R.O.C.), the National Health Research Institutes grant (NHRI-EX112-11205EC), and the Alzheimer's Association (AARFD-21-849349), GE Healthcare, and Life Molecular Imaging.
Disclosure forms provided by the authors are available with the full text and PDF of this article at www.ajnr.org.
Indicates open access to non-subscribers at www.ajnr.org
References
- Received November 3, 2022.
- Accepted after revision July 11, 2023.
- © 2023 by American Journal of Neuroradiology


