Advertisement

Main menu

  • Home
  • Content
    • Current Issue
    • Accepted Manuscripts
    • Article Preview
    • Past Issue Archive
    • AJNR Case Collection
    • Case of the Week Archive
    • Classic Case Archive
    • Case of the Month Archive
  • Special Collections
    • Spinal CSF Leak Articles (Jan 2020-June 2024)
    • 2024 AJNR Journal Awards
    • Most Impactful AJNR Articles
  • Multimedia
    • AJNR Podcast
    • AJNR Scantastics
    • Video Articles
  • For Authors
    • Submit a Manuscript
    • Author Policies
    • Fast publishing of Accepted Manuscripts
    • Graphical Abstract Preparation
    • Manuscript Submission Guidelines
    • Imaging Protocol Submission
    • Submit a Case for the Case Collection
  • About Us
    • About AJNR
    • Editorial Board
  • More
    • Become a Reviewer/Academy of Reviewers
    • Subscribers
    • Permissions
    • Alerts
    • Feedback
    • Advertisers
    • ASNR Home
  • Other Publications
    • ajnr

User menu

  • Alerts
  • Log in

Search

  • Advanced search
American Journal of Neuroradiology

American Journal of Neuroradiology

ASHNR American Society of Functional Neuroradiology ASHNR American Society of Pediatric Neuroradiology ASSR
  • Alerts
  • Log in

Advanced Search

  • Home
  • Content
    • Current Issue
    • Accepted Manuscripts
    • Article Preview
    • Past Issue Archive
    • AJNR Case Collection
    • Case of the Week Archive
    • Classic Case Archive
    • Case of the Month Archive
  • Special Collections
    • Spinal CSF Leak Articles (Jan 2020-June 2024)
    • 2024 AJNR Journal Awards
    • Most Impactful AJNR Articles
  • Multimedia
    • AJNR Podcast
    • AJNR Scantastics
    • Video Articles
  • For Authors
    • Submit a Manuscript
    • Author Policies
    • Fast publishing of Accepted Manuscripts
    • Graphical Abstract Preparation
    • Manuscript Submission Guidelines
    • Imaging Protocol Submission
    • Submit a Case for the Case Collection
  • About Us
    • About AJNR
    • Editorial Board
  • More
    • Become a Reviewer/Academy of Reviewers
    • Subscribers
    • Permissions
    • Alerts
    • Feedback
    • Advertisers
    • ASNR Home
  • Follow AJNR on Twitter
  • Visit AJNR on Facebook
  • Follow AJNR on Instagram
  • Join AJNR on LinkedIn
  • RSS Feeds

Welcome to the new AJNR, Updated Hall of Fame, and more. Read the full announcements.


AJNR is seeking candidates for the position of Associate Section Editor, AJNR Case Collection. Read the full announcement.


Research ArticleExtracranial Vascular

Changes of Time-Attenuation Curve Blood Flow Parameters in Patients with and without Carotid Stenosis

C.-J. Lin, F.-C. Chang, W.-Y. Guo, S.-C. Hung, C.-B. Luo, J. Beilner, M. Kowarschik and W.-F. Chu
American Journal of Neuroradiology June 2015, 36 (6) 1176-1181; DOI: https://doi.org/10.3174/ajnr.A4239
C.-J. Lin
aFrom the Department of Radiology (C.-J.L., F.-C.C., W.-Y.G., S.-C.H., C.-B.L., W.-F.C.), Taipei Veterans General Hospital, Taipei, Taiwan
bSchool of Medicine (C.-J.L., F.-C.C., W.-Y.G., S.-C.H., C.-B.L.), National Yang-Ming University, Taipei, Taiwan
  • Find this author on Google Scholar
  • Find this author on PubMed
  • Search for this author on this site
F.-C. Chang
aFrom the Department of Radiology (C.-J.L., F.-C.C., W.-Y.G., S.-C.H., C.-B.L., W.-F.C.), Taipei Veterans General Hospital, Taipei, Taiwan
bSchool of Medicine (C.-J.L., F.-C.C., W.-Y.G., S.-C.H., C.-B.L.), National Yang-Ming University, Taipei, Taiwan
  • Find this author on Google Scholar
  • Find this author on PubMed
  • Search for this author on this site
W.-Y. Guo
aFrom the Department of Radiology (C.-J.L., F.-C.C., W.-Y.G., S.-C.H., C.-B.L., W.-F.C.), Taipei Veterans General Hospital, Taipei, Taiwan
bSchool of Medicine (C.-J.L., F.-C.C., W.-Y.G., S.-C.H., C.-B.L.), National Yang-Ming University, Taipei, Taiwan
  • Find this author on Google Scholar
  • Find this author on PubMed
  • Search for this author on this site
S.-C. Hung
aFrom the Department of Radiology (C.-J.L., F.-C.C., W.-Y.G., S.-C.H., C.-B.L., W.-F.C.), Taipei Veterans General Hospital, Taipei, Taiwan
bSchool of Medicine (C.-J.L., F.-C.C., W.-Y.G., S.-C.H., C.-B.L.), National Yang-Ming University, Taipei, Taiwan
  • Find this author on Google Scholar
  • Find this author on PubMed
  • Search for this author on this site
C.-B. Luo
aFrom the Department of Radiology (C.-J.L., F.-C.C., W.-Y.G., S.-C.H., C.-B.L., W.-F.C.), Taipei Veterans General Hospital, Taipei, Taiwan
bSchool of Medicine (C.-J.L., F.-C.C., W.-Y.G., S.-C.H., C.-B.L.), National Yang-Ming University, Taipei, Taiwan
  • Find this author on Google Scholar
  • Find this author on PubMed
  • Search for this author on this site
J. Beilner
cAngiography and Interventional X-Ray Systems (J.B.), Siemens Ltd China, Healthcare Sector, Shanghai, P.R. China
  • Find this author on Google Scholar
  • Find this author on PubMed
  • Search for this author on this site
M. Kowarschik
dAngiography and Interventional X-Ray Systems (M.K.), Siemens AG, Healthcare Sector, Erlangen, Germany.
  • Find this author on Google Scholar
  • Find this author on PubMed
  • Search for this author on this site
W.-F. Chu
aFrom the Department of Radiology (C.-J.L., F.-C.C., W.-Y.G., S.-C.H., C.-B.L., W.-F.C.), Taipei Veterans General Hospital, Taipei, Taiwan
  • Find this author on Google Scholar
  • Find this author on PubMed
  • Search for this author on this site
  • Article
  • Figures & Data
  • Info & Metrics
  • Responses
  • References
  • PDF
Loading

Abstract

BACKGROUND AND PURPOSE: From the time-attenuation curves of DSA flow parameters, maximal intensity, maximal slope, and full width at half maximum of selected vascular points are defined. The study explores the reliability of defining the flow parameters by the time-attenuation curves of DSA.

MATERIALS AND METHODS: Seventy patients with unilateral carotid artery stenosis (group A) and 56 healthy controls (group B) were retrospectively enrolled. Fixed contrast injection protocols and DSA acquisition parameters were used with all patients. The M1, sigmoid sinus, and internal jugular vein on anteroposterior view DSA and the M2, parietal vein, and superior sagittal sinus on lateral view DSA were chosen as ROI targets for measuring flow parameters. The difference of time of maximal intensity between 2 target points was defined as the circulation time between the target points.

RESULTS: The maximal intensity difference of 2 selected points from the ICA to the M1, sigmoid sinus, internal jugular vein, M2, parietal vein, and superior sagittal sinus was significantly longer in group A than in group B. The maximum slope of M1, M2, and the superior sagittal sinus was significantly lower in group A than in group B. The full width at half maximum of M1 and M2 was significantly larger in group A than in group B. The maximal slope of M1 demonstrated the best diagnostic performance.

CONCLUSIONS: The maximal intensity difference of 2 selected points derived from DSA can be used as a definitive alternative flow parameter for intracranial circulation time measurement. Maximal slope and full width at half maximum complement the maximal intensity difference of 2 selected points in defining flow characteristics of healthy subjects and patients with carotid stenosis.

ABBREVIATIONS:

FWHM
full width at half maximum
MS
maximal slope
PV
parietal vein
SSS
superior sagittal sinus
TDC
time-attenuation curve
Tmax
time of maximal intensity
rTmax
Tmax difference of 2 selected points

DSA is the standard reference for diagnosing cerebrovascular diseases with its superior temporal and spatial resolution compared with other imaging methods.1⇓–3 Using different approaches, a number of recent studies have demonstrated the feasibility of quantitative flow parameter measurement by using flat detector DSA.4⇓⇓–7 Compared with optical flow methods and computer fluid dynamics simulations, flow parameter analysis with the time-attenuation curve (TDC) of DSA images is less demanding in terms of computer power and processing time.8,9 Clinically, TDCs are used to assess the “real-time” peritherapeutic hemodynamics of various vascular disorders in an angiography suite.10⇓–12 The TDC represents the dynamic intensity changes of a contrast bolus passing an ROI. It is affected by the bolus characteristics and physiologic and anatomic conditions (eg, arterial stenosis or arteriovenous shunts).11,13 From the TDC, we may measure the time of maximal intensity (Tmax), maximal slope (MS), and full width at half maximum (FWHM) of any selected vascular point on the DSA image. The time difference to reach maximum intensity (rTmax) of 2 selected vascular points indicates the circulation time between these 2 points. Accordingly, cerebral circulation time is defined as the rTmax between the internal carotid artery and the parietal vein (PV). The PV is closer to the brain parenchyma compared with the transverse sinus or jugular vein and thus better represents the time for blood flow to travel through the brain parenchyma.14 Circulation time is an objective flow parameter for various vascular disorders (eg, carotid stenosis, carotid cavernous fistula, and peritherapeutic assessment).10,12,15,16 The aim of the present study was to compare the diagnostic accuracy of rTmax, MS, and FWHM for detecting blood flow property changes by using a large sample of healthy subjects and patients with carotid stenosis.

Materials and Methods

Patient Selection

The institutional review board of the hospital approved this retrospective study, and patient consent forms were waived. From October 2011 to December 2013, 546 patients were consecutively referred to our institution for DSA. Patients with poor heart function present with polymorphic TDC waveforms and thus make identification of Tmax and subsequent measurement of MS and FWHM difficult. After we excluded patients with poor renal and/or heart functions and previous large territorial infarct and those whose imaging did not follow the standard DSA acquisition protocol, 126 patients eligible for analysis were retrospectively recruited for the current study. Seventy of 126 patients (mean age, 73.6 years; 59 men and 11 women) with unilateral extracranial internal carotid artery stenosis (>70%, based on the NASCET criteria) were classified as group A. The other 56 patients (mean age, 65.6 years; 26 men and 30 women) referred for DSA with nonarterial occlusive disorders (namely, post-aneurysm clipping/coiling follow-up and suspected vascular lesions with negative angiography findings) were classified as group B.

Imaging Protocol and Data Analysis

DSA acquisitions with a standard, clinically routine protocol were performed in all 126 cases. A power injector (Liebel-Flarsheim Angiomat; Illumena, San Diego, California) was used to create a contrast bolus after placing a 4F angiocatheter in the common carotid artery at the C4 vertebral body level. A bolus of 12 mL of 60% diluted contrast medium (340 mg I/mL) was administered within 1.5 seconds. Neither extra contrast medium nor extra radiation was used. The acquisition parameters were 7.5 frames/s for the first 5 seconds, followed by 4 frames/s for 3 seconds, 3 frames/s for 2 seconds, and finally 2 frames/s for 2 seconds. The entire DSA acquisition time was 12 seconds. However, it might be manually tailored to be shortened or prolonged for optimized internal jugular vein opacification.10 The mean and range of irradiation parameters and dosage were the following: 91.4 (88–97) kV, 287.8 (268–318) mA, 29.1 (29.1–29.2) ms, and 1.21 (0.7–1.78) mGy/frame for anteroposterior views and 73.4 (70–92) kV, 402.5 (283–426) mA, 29.1 (29.1–29.2) ms, and 1.30 (0.68–1.86) mGy/frame for lateral views.

DSAs of contralateral (normal) sides in group A were not evaluated, mainly due to different FOVs routinely used in our institution for the contralateral (normal) side of patients with unilateral internal carotid artery stenosis. There were 24 patients with hypoplasia or aplasia of the anterior communicating artery in group A. The same biplane angiography suite (Axiom Artis dBA; Siemens, Erlangen, Germany) was used for DSA throughout the entire study. The degree of arterial stenosis was determined by the more severe degree on anteroposterior lateral views according to the NASCET criteria.17 All DSA analyses were performed on a workstation equipped with prototype software, DSA Analyzer (Siemens). DSA Analyzer is a software package for analyzing 2D DSA image series. It represents an extended version of the commercially available software tool syngo iFlow (Siemens). On the basis of the TDC, DSA Analyzer extracts flow parameters (eg, Tmax, MS, and FWHM) of user-selected vascular points or ROIs on DSA.

Selection of ROIs

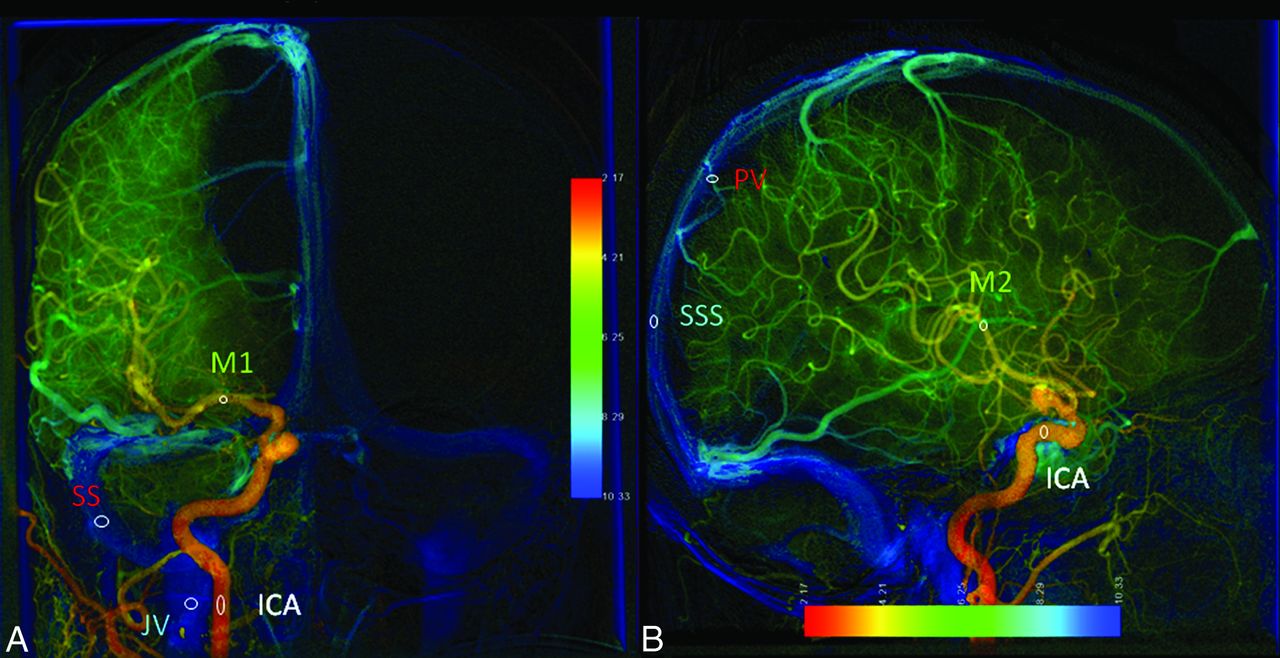
Parametric color-coding of DSA according to the Tmax of individual pixels was displayed instantly.4 On the basis of previous research, we placed ROIs on the first segment of the middle cerebral artery, sigmoid sinus, and ipsilateral internal jugular vein on anteroposterior view DSA and on the second branch of the middle cerebral artery, parietal vein, and superior sagittal sinus (SSS) on lateral view DSA for flow parameter analyses (Fig 1).10,14 The ROI placement was standardized to avoid overlapping anatomic structures and inhomogeneous areas and to use the caliber of the target vessel as the diameter of an ROI.10 One neuroradiologist with 8 years' experience and 1 angiographic technician performed the ROI placements by consensus. Both were unaware of the clinical conditions of the studied subjects.

Fig 1.
  • Download figure
  • Open in new tab
  • Download powerpoint
Fig 1.

Anteroposterior (A) and lateral (B) views of parametric color-coding of quantitative DSA. A, The ROI of the ICA is located at the midpoint of the cervical portion of the ICA. The ROI of M1 is located at the midpoint of the first segment of the middle cerebral artery. The sigmoid sinus ROI is located at the midpoint of the ipsilateral sigmoid sinus. The jugular vein ROI is located in the internal jugular vein at the same level as the ICA ROI. B, The ICA ROI is located in the cavernous portion of the ICA. The M2 ROI is located in the insular branch of the MCA. The PV ROI is located in the outlet of the parietal vein. The SSS ROI is located 2 cm above the confluence of the SSS.

Definition of Flow Parameters

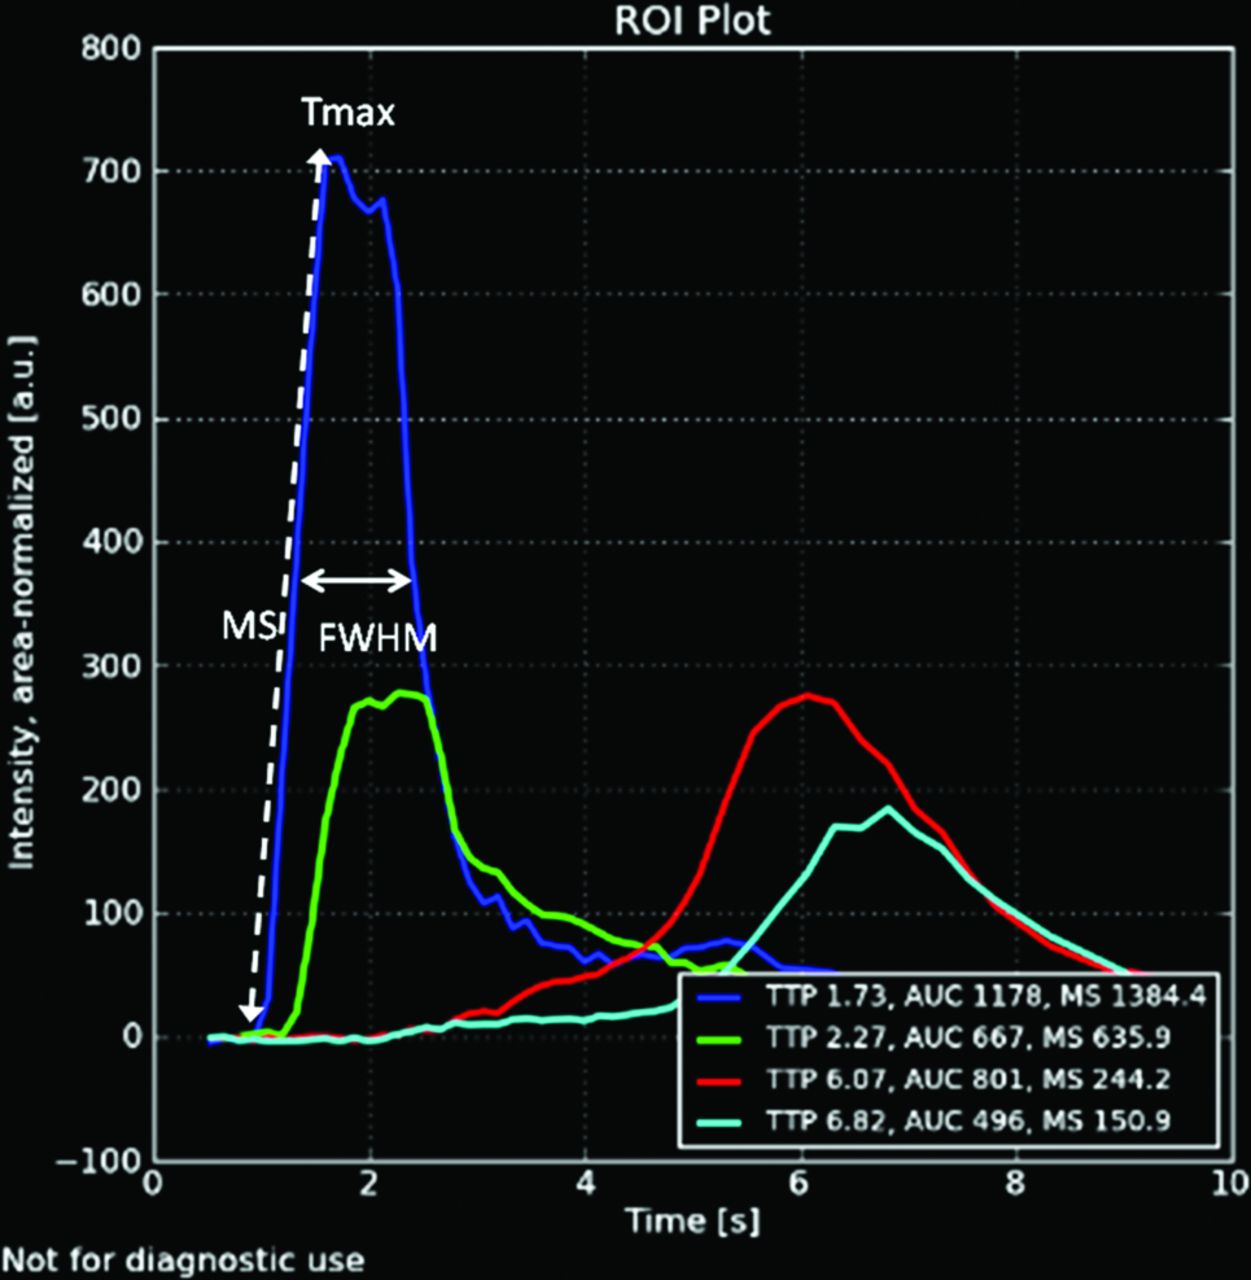
After ROI placements, 3 flow parameters (Tmax, MS, and FWHM) were immediately extracted from the respective TDCs. “Tmax” was defined as the time point at which the pixel reached its maximum concentration during the angiographic series. “MS” was defined as the maximum tangential slope between the arrival time of the contrast medium and the Tmax on the TDC. “FWHM” was defined as the width of the 2 time points on the TDC when the concentration reached half of the maximum concentration (Fig 2). Tmax of the ROIs was normalized by subtraction of the Tmax of the cervical ICA on the anteroposterior view or cavernous ICA on the lateral view. The normalized time difference was defined as rTmax—that is, the circulation time between 2 selected vascular points. Accordingly, rTmax ICA-PV was referred to as “cerebral circulation time,” the time for blood flow to travel through the brain parenchyma.14

Fig 2.
  • Download figure
  • Open in new tab
  • Download powerpoint
Fig 2.

Time-attenuation curves of lateral view DSA in a healthy subject. The blue curve represents the TDC of the ROI in the cavernous portion of the ICA. Tmax is the time point at which the ROI reaches maximal intensity. The MS of an ROI is defined by the maximal tangential slope located between arrival time and Tmax. FWHM is the width of the waveform at the level of half maximum concentration.

Statistical Analysis

All statistical analyses were performed by using SPSS 20 (2010; IBM, Armonk, New York). The correlation between the stenotic degree and TDC flow parameters (rTmax, MS, and FWHM) was explored by using the Pearson correlations. The differences of rTmax, MS, and FWHM between groups A and B were compared by using a Student t test. We used receiver operating characteristic curves to evaluate the diagnostic performance of the above-mentioned flow parameters in carotid stenosis. The maximum area under the curve of the receiver operating characteristic was used to determine the optimal cutoff value. Significance was set to P < .05 for all statistical tests.

Results

No subjects in group A had acute stroke peritherapeutically evidenced by MR imaging. The patient demographic data are listed in Table 1. The average age in group A (73.6 ± 11.6 years) was older than that for group B (65.6 ± 10.2 years). Stenotic degree had a mild positive correlation with rTmax in M2 (r = 0.380) and M1 (r = 0.486) and FWHM in M2 (r = 0.34) and a mild negative correlation with MS in PV (−0.448) (Table 2). MS of the PV was the only venous ROI showing a negative correlation with stenotic degree.

View this table:
  • View inline
  • View popup
Table 1:

Patient characteristics for groups A and B

View this table:
  • View inline
  • View popup
Table 2:

Correlation of degree of stenosis with rTmax, MS, and FWHMa

The comparison of rTmax, MS, and FWHM in 6 ROIs between groups A and B is shown in Table 3. All rTmax values were significantly longer in group A than in group B. For MS, only the M1, M2, and SSS of group A demonstrated flatter slopes than in group B. For FWHM, only M1 and M2 demonstrated significantly wider waveforms in group A than in group B. None of the venous ROIs demonstrated significantly wider waveforms in group A.

View this table:
  • View inline
  • View popup
Table 3:

Comparison of group A and B values for rTmax, MS, and FWHM for 6 different ROIs

M1 and M2 are the only ROIs with all 3 flow parameters demonstrating significant differences between 2 groups. SSS is the only venous ROI with 2 flow parameters (rTmax and MS) showing significant differences between the 2 groups.

Figure 3 illustrates the receiver operating characteristic curves of the flow parameters (6 rTmax, 3 MS, and 2 FWHM) to compare their diagnostic performance in detecting carotid stenosis. The 4 best diagnostic flow parameters were MS in M1 (cutoff value, 378.3; sensitivity, 66.7%; specificity, 60.0%), followed by FWHM in M1 (cutoff value, 3.40; sensitivity, 57.1%; specificity, 78.4%), rTmax of M1 (cutoff value, 0.45; sensitivity, 81%; specificity, 58.2%), and rTmax of SSS (cutoff value, 6.895; sensitivity, 55.2%; specificity, 73.7%) (Table 4).

Fig 3.
  • Download figure
  • Open in new tab
  • Download powerpoint
Fig 3.

Receiver operating characteristic curves of all significantly different rTmax values (A), all significantly different MS values (B), and all significantly different FWHM values (C) in differentiating patients with stenosis from control groups.

View this table:
  • View inline
  • View popup
Table 4:

Cutoff values of 10 significant TDC parameters for detecting stenosis flow with optimized sensitivity and specificity

Discussion

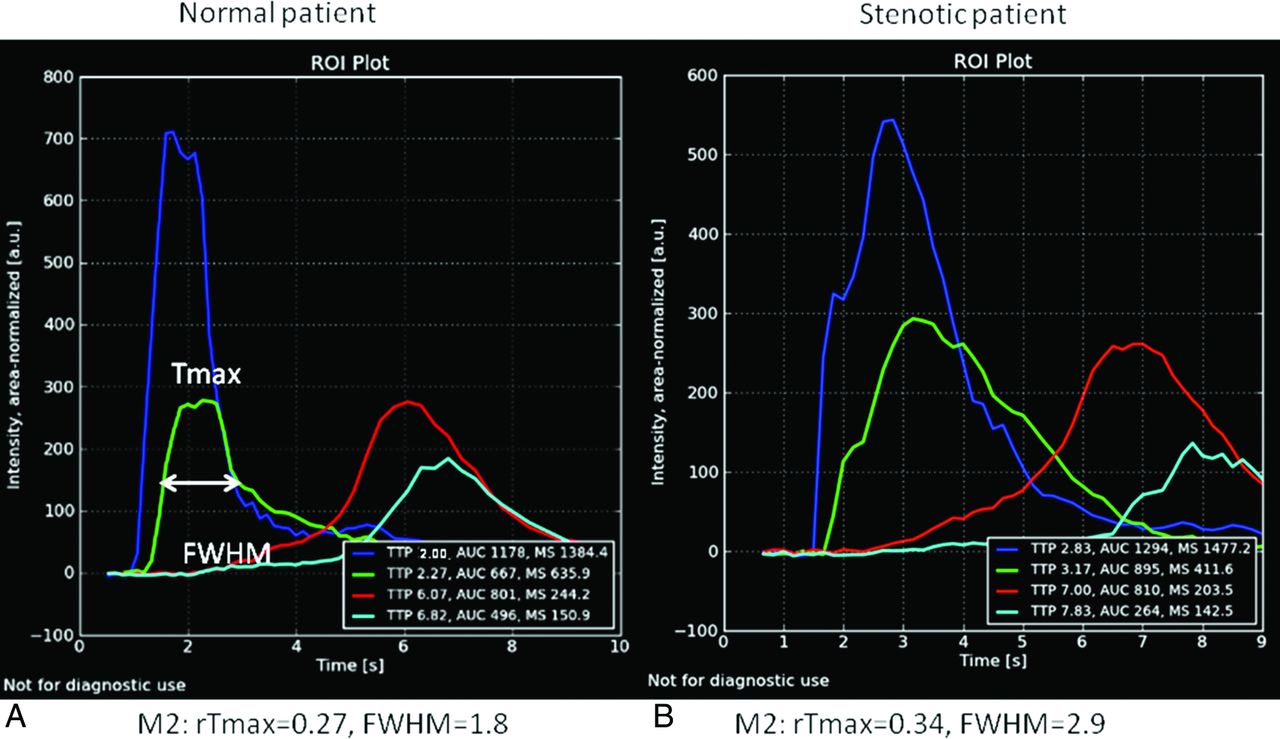
Within normal physiologic conditions, the degree of carotid stenosis has greater impact on rTmax than on MS and FWHM. Carotid stenosis makes the waveform of the poststenotic arterial segment delayed (prolonged rTmax in group A) and wider (larger FWHM values in group A) (Fig 4). This effect has also been observed as delay and dispersion effects in MR imaging and CT perfusion studies.18,19 Doppler sonography illustrates the phenomenon, known as “tardus parvus,” due to the widened and flatter poststenotic waveform.20,21

Fig 4.
  • Download figure
  • Open in new tab
  • Download powerpoint
Fig 4.

TDC of lateral views of angiography are from a healthy individual (A) and a patient with 80% carotid stenosis (B). Both green lines are TDCs of M2. The rTmax of M2 in the patient with stenosis is 0.34 seconds, which was more prolonged than that (0.27 seconds) in the healthy individual. The FWHM of M2 (2.9 seconds) in the patient with stenosis is longer than that (1.8 seconds) in the healthy individual. The ICA (dark blue curves), sigmoid sinus (red curves), and internal jugular vein (light blue curves) all demonstrate prolonged rTmax and are right-shifted in the patient with stenosis. These delayed and dispersed phenomena of angiographic TDCs are consistent with those observed in MR imaging and CT perfusion imaging.

rTmax values of arteries and veins (artery-vein) were prolonged in group A (defined by the presence of carotid stenosis). Proximal arterial stenosis may transit the slowdown effects on blood flow to the downstream areas of the brain parenchyma. Poststenting normalization of rTmax artery-vein in carotid occlusive arterial disease indicates restoration of both arterial and venous blood flows.14,22 Patients who have ipsilateral stenotic and hypoplastic venous outlets are prone to develop hyperperfusion syndrome after stent placement.22⇓–24

MS was considered a surrogate marker for intravascular velocity because it represents the maximum gradient of x-ray attenuation and therefore reflects the speed of contrast medium (ie, the blood flow velocity).11,25 Theoretically, MS should be more sensitive to flow changes compared with rTmax. Nevertheless, only 2 arterial ROIs (M1, M2) and 1 venous ROI (SSS) demonstrated a significant decrease in MS in group A. As for FWHM, values were wider only in M2 and M1 in group A but not in any venous ROIs. If we take the receiver operating characteristic curves into consideration, M1 was the best location for detecting stenosis because its 3 flow parameters all showed reasonably high diagnostic performance. rTmax is still the best flow parameter among the 3 because the rTmax of all ROIs was prolonged and therefore demonstrated delayed reach of wave peaks in the TDC chart in group A (Fig 4). MS and FWHM illustrated less impact on venous flows. One plausible explanation would be that the smaller amplitude of the waveform and the encountering of more anatomic variation in the intracranial venous system make venous flow more complicated and MS and FWHM less sensitive. Additionally, the unpredictable inflow of blood without contrast from other vascular territories changes the attenuation of TDC and makes analysis of venous ROIs challenging.

Optical flow methods and computer fluid dynamics simulations quantify flows with an alternative approach, and both are highly demanding in terms of computer power and processing time. Until now, they have been available mainly in research institutes, and their roles in clinical applications are still limited. Nevertheless, computer fluid dynamics measures exclusively in vivo flow information in aneurysmal and juxta-aneurysmal areas.26,27 Its role in stenotic cerebrovascular disease is not clear. The current study results showed that MS and FWHM were only clinically significant in limited ROIs and were complementary to rTmax in describing flows.

Several limitations exist in our study. The DSA series was 2D; therefore, the overlapping of anatomic structures mixed and distorted the TDCs. Future research by using 3D DSA datasets would resolve this issue.5,28⇓⇓–31 Curve fitting or using the average slopes of ascending parts of the TDC would improve the reliability of MS and FWHM. Other potential flow parameters (eg, arrival time, kurtosis, and skewness) can describe bolus characteristics. The size and location of previous infarction might affect the measurements of the TDC but were not explored in the current study. According to our initial experience, those with old small lacunar infarcts or subterritorial infarct usually develop collateral circulation. Therefore, chronic ischemic insults might influence the rTmax or circulation, but stenotic degree still dominates in terms of TDC changes.

Our study offers reassurance about the reliability of evaluating intravascular flows by TDC and offers a real-time clinically diagnostic tool to tailor endovascular treatment within the angiography suite.26,32 Currently, the ROIs are placed manually. Future work on automation in ROI placement based on selecting the best-described waveform of flows may further shorten the assessment time and broaden the clinical application of color-coded quantitative DSA.

Conclusions

Our study confirmed that rTmax remains the preferred measurement for all ROIs when a single-flow parameter is used. MS and FWHM demonstrated equivalent diagnostic performance in differentiating carotid stenosis and thus can serve as complementary diagnostic parameters because neither alone achieves excellent sensitivity or specificity.

Acknowledgments

We thank Josephe Lavalle for manuscript preparation and. C.S. Lin for statistical support.

Footnotes

  • Disclosures: Wan-Yuo Guo—UNRELATED: Grant: collaboration between Institution and Siemens*; Support for Travel to Meetings for the Study or Other Purposes: Taipei Veterans General Hospital,* Comments: to present the study results; Provision of Writing Assistance, Medicines, Equipment, or Administrative Support: software provided by Siemens under the collaboration contract. Janina Beilner—OTHER RELATIONSHIPS: In this study, Siemens software was used. I am a Siemens employee. Markus Kowarschik—OTHER RELATIONSHIPS: Employee of Siemens. *Money paid to the institution.

  • This work was cosponsored by the Taipei Veterans General Hospital and Siemens (grant No: T1100200).

References

  1. 1.↵
    1. Raney R,
    2. Raney AA,
    3. Sanchez-Perez JM
    . The role of complete cerebral angiography in neurosurgery. J Neurosurg 1949;6:222–37
    CrossRefPubMed
  2. 2.↵
    1. Luo Z,
    2. Wang D,
    3. Sun X, et al
    . Comparison of the accuracy of subtraction CT angiography performed on 320-detector row volume CT with conventional CT angiography for diagnosis of intracranial aneurysms. Eur J Radiol 2012;81:118–22
    CrossRefPubMed
  3. 3.↵
    1. Petkova M,
    2. Gauvrit J-Y,
    3. Trystram D, et al
    . Three-dimensional dynamic time-resolved contrast-enhanced MRA using parallel imaging and a variable rate k-space sampling strategy in intracranial arteriovenous malformations. J Magn Reson Imaging 2009;29:7–12
    CrossRefPubMed
  4. 4.↵
    1. Strother CM,
    2. Bender F,
    3. Deuerling-Zheng Y, et al
    . Parametric color coding of digital subtraction angiography. AJNR Am J Neuroradiol 2010;31:919–24
    Abstract/FREE Full Text
  5. 5.↵
    1. Pereira V,
    2. Ouared R,
    3. Brina O, et al
    . Quantification of internal carotid artery flow with digital subtraction angiography: validation of an optical flow approach with Doppler ultrasound. AJNR Am J Neuroradiol 2014;35:156–63
    Abstract/FREE Full Text
  6. 6.↵
    1. Xiang J,
    2. Tutino VM,
    3. Snyder KV, et al
    . CFD: computational fluid dynamics or confounding factor dissemination? The role of hemodynamics in intracranial aneurysm rupture risk assessment. AJNR Am J Neuroradiol 2014;35:1849–57
    Abstract/FREE Full Text
  7. 7.↵
    1. Kefayati S,
    2. Poepping TL
    . Transitional flow analysis in the carotid artery bifurcation by proper orthogonal decomposition and particle image velocimetry. Med Eng Phys 2013;35:898–909
    CrossRefPubMed
  8. 8.↵
    1. Pasta S,
    2. Cho JS,
    3. Dur O, et al
    . Computer modeling for the prediction of thoracic aortic stent graft collapse. J Vasc Surg 2013;57:1353–61
    CrossRefPubMed
  9. 9.↵
    1. Huang TC,
    2. Wu TH,
    3. Lin CJ, et al
    . Peritherapeutic quantitative flow analysis of arteriovenous malformation on digital subtraction angiography. J Vasc Surg 2012;56:812–15
    CrossRefPubMed
  10. 10.↵
    1. Lin CJ,
    2. Hung SC,
    3. Guo WY, et al
    . Monitoring peri-therapeutic cerebral circulation time: a feasibility study using color-coded quantitative DSA in patients with steno-occlusive arterial disease. AJNR Am J Neuroradiol 2012;33:1685–90
    Abstract/FREE Full Text
  11. 11.↵
    1. Shpilfoygel SD,
    2. Close RA,
    3. Valentino DJ, et al
    . X-ray videodensitometric methods for blood flow and velocity measurement: a critical review of literature. Med Phys 2000;27:2008–23
    CrossRefPubMed
  12. 12.↵
    1. Gölitz P,
    2. Struffert T,
    3. Lücking H, et al
    . Parametric color coding of digital subtraction angiography in the evaluation of carotid cavernous fistulas. Clin Neuroradiol 2013;23:113–20
    CrossRefPubMed
  13. 13.↵
    1. Wilcox BR,
    2. Coulter NA,
    3. Rackley CE, et al
    . The effect of changing heart rate on blood flow, power dissipation, and resistance in the common carotid artery of man. Ann Surg 1970;171:24–30
    CrossRefPubMed
  14. 14.↵
    1. Greitz T
    . A radiologic study of the brain circulation by rapid serial angiography of the carotid artery. Acta Radiol Suppl 1956;1–123
  15. 15.↵
    1. Lin CJ,
    2. Luo CB,
    3. Hung SC, et al
    . Application of color-coded digital subtraction angiography in treatment of indirect carotid-cavernous fistulas: initial experience. J Chin Med Assoc 2013;76:218–24
    CrossRefPubMed
  16. 16.↵
    1. Gado M,
    2. Eichling J,
    3. Grubb R, et al
    . Appraisal of the angiographic circulation time as an index of cerebral blood flow. Radiology 1975;115:107–12
    CrossRefPubMed
  17. 17.↵
    North American Symptomatic Carotid Endarterectomy Trial Collaborators. Beneficial effect of carotid endarterectomy in symptomatic patients with high-grade carotid stenosis. N Engl J Med 1991;325:445–53
    CrossRefPubMed
  18. 18.↵
    1. Calamante F
    . Arterial input function in perfusion MRI: a comprehensive review. Prog Nucl Magn Reson Spectrosc 2013;74:1–32
    CrossRefPubMed
  19. 19.↵
    1. Kudo K,
    2. Sasaki M,
    3. Ogasawara K, et al
    . Difference in tracer delay-induced effect among deconvolution algorithms in CT perfusion analysis: quantitative evaluation with digital phantoms. Radiology 2009;251:241–49
    CrossRefPubMed
  20. 20.↵
    1. Withers CE,
    2. Gosink BB,
    3. Keightley AM, et al
    . Duplex carotid sonography: peak systolic velocity in quantifying internal carotid artery stenosis. J Ultrasound Med 1990;9:345–49
    Abstract
  21. 21.↵
    1. Blackshear WM,
    2. Phillips DJ,
    3. Chikos PM, et al
    . Carotid artery velocity patterns in normal and stenotic vessels. Stroke 1980;11:67–71
    Abstract/FREE Full Text
  22. 22.↵
    1. Lin CJ,
    2. Chang FC,
    3. Tsai FY, et al
    . Stenotic transverse sinus predisposes to poststenting hyperperfusion syndrome as evidenced by quantitative analysis of peritherapeutic cerebral circulation time. AJNR Am J Neuroradiol 2014;35:1132–36
    Abstract/FREE Full Text
  23. 23.↵
    1. Narita S,
    2. Aikawa H,
    3. Nagata S, et al
    . Intraprocedural prediction of hemorrhagic cerebral hyperperfusion syndrome after carotid artery stenting. J Stroke Cerebrovasc Dis 2013;22:615–19
    CrossRefPubMed
  24. 24.↵
    1. Aikawa H,
    2. Kazekawa K,
    3. Tsutsumi M, et al
    . Intraprocedural changes in angiographic cerebral circulation time predict cerebral blood flow after carotid artery stenting. Neurol Med Chir (Tokyo) 2010;50:269–74
    CrossRefPubMed
  25. 25.↵
    1. Levitt MR,
    2. Morton RP,
    3. Haynor DR, et al
    . Angiographic perfusion imaging: real-time assessment of endovascular treatment for cerebral vasospasm. J Neuroimaging 2014;24:387–92
    CrossRefPubMed
  26. 26.↵
    1. Rhode KS,
    2. Lambrou T,
    3. Hawkes DJ, et al
    . Novel approaches to the measurement of arterial blood flow from dynamic digital x-ray images. IEEE Trans Med Imaging 2005;24:500–13
    CrossRefPubMed
  27. 27.↵
    1. Shobayashi Y,
    2. Tateshima S,
    3. Kakizaki R, et al
    . Intra-aneurysmal hemodynamic alterations by a self-expandable intracranial stent and flow diversion stent: high intra-aneurysmal pressure remains regardless of flow velocity reduction. J Neurointerv Surg 2013;5(suppl 3):iii38–42
    Abstract/FREE Full Text
  28. 28.↵
    1. Waechter I,
    2. Bredno J,
    3. Hermans R, et al
    . Model-based blood flow quantification from rotational angiography. Med Image Anal 2008;12:586–602
    CrossRefPubMed
  29. 29.↵
    1. Waechter I,
    2. Bredno J,
    3. Weese J, et al
    . Using flow information to support 3D vessel reconstruction from rotational angiography. Med Phys 2008;35:3302–16
    CrossRefPubMed
  30. 30.↵
    1. Bogunović H,
    2. Loncarić S
    . Blood flow and velocity estimation based on vessel transit time by combining 2D and 3D X-ray angiography. Med Image Comput Comput Assist Interv 2006;9(pt 2):117–24
  31. 31.↵
    1. Davis B,
    2. Royalty K,
    3. Kowarschik M, et al
    . 4D digital subtraction angiography: implementation and demonstration of feasibility. AJNR Am J Neuroradiol 2013;34:1914–21
    Abstract/FREE Full Text
  32. 32.↵
    1. Hung SC,
    2. Lin CJ,
    3. Guo WY, et al
    . Toward the era of a one-stop imaging service using an angiography suite for neurovascular disorders. Biomed Res Int 2013;2013:873614
    PubMed
  • Received August 10, 2014.
  • Accepted after revision December 1, 2014.
  • © 2015 by American Journal of Neuroradiology
View Abstract
PreviousNext
Back to top

In this issue

American Journal of Neuroradiology: 36 (6)
American Journal of Neuroradiology
Vol. 36, Issue 6
1 Jun 2015
  • Table of Contents
  • Index by author
  • Complete Issue (PDF)
Advertisement
Print
Download PDF
Email Article

Thank you for your interest in spreading the word on American Journal of Neuroradiology.

NOTE: We only request your email address so that the person you are recommending the page to knows that you wanted them to see it, and that it is not junk mail. We do not capture any email address.

Enter multiple addresses on separate lines or separate them with commas.
Changes of Time-Attenuation Curve Blood Flow Parameters in Patients with and without Carotid Stenosis
(Your Name) has sent you a message from American Journal of Neuroradiology
(Your Name) thought you would like to see the American Journal of Neuroradiology web site.
CAPTCHA
This question is for testing whether or not you are a human visitor and to prevent automated spam submissions.
Cite this article
C.-J. Lin, F.-C. Chang, W.-Y. Guo, S.-C. Hung, C.-B. Luo, J. Beilner, M. Kowarschik, W.-F. Chu
Changes of Time-Attenuation Curve Blood Flow Parameters in Patients with and without Carotid Stenosis
American Journal of Neuroradiology Jun 2015, 36 (6) 1176-1181; DOI: 10.3174/ajnr.A4239

Citation Manager Formats

  • BibTeX
  • Bookends
  • EasyBib
  • EndNote (tagged)
  • EndNote 8 (xml)
  • Medlars
  • Mendeley
  • Papers
  • RefWorks Tagged
  • Ref Manager
  • RIS
  • Zotero
0 Responses
Respond to this article
Share
Bookmark this article
Changes of Time-Attenuation Curve Blood Flow Parameters in Patients with and without Carotid Stenosis
C.-J. Lin, F.-C. Chang, W.-Y. Guo, S.-C. Hung, C.-B. Luo, J. Beilner, M. Kowarschik, W.-F. Chu
American Journal of Neuroradiology Jun 2015, 36 (6) 1176-1181; DOI: 10.3174/ajnr.A4239
del.icio.us logo Twitter logo Facebook logo Mendeley logo
  • Tweet Widget
  • Facebook Like
  • Google Plus One
Purchase

Jump to section

  • Article
    • Abstract
    • ABBREVIATIONS:
    • Materials and Methods
    • Results
    • Discussion
    • Conclusions
    • Acknowledgments
    • Footnotes
    • References
  • Figures & Data
  • Info & Metrics
  • Responses
  • References
  • PDF

Related Articles

  • No related articles found.
  • PubMed
  • Google Scholar

Cited By...

  • Carotid webs produce greater hemodynamic disturbances than atherosclerotic disease: a DSA time-density curve study
  • Prolonged cerebral circulation time is more associated with symptomatic carotid stenosis than stenosis degree or collateral circulation
  • Peritherapeutic Hemodynamic Changes of Carotid Stenting Evaluated with Quantitative DSA in Patients with Carotid Stenosis
  • Crossref (12)
  • Google Scholar

This article has been cited by the following articles in journals that are participating in Crossref Cited-by Linking.

  • Carotid webs produce greater hemodynamic disturbances than atherosclerotic disease: a DSA time–density curve study
    Charlie C Park, Retta El Sayed, Benjamin B Risk, Diogo C Haussen, Raul G Nogueira, John N Oshinski, Jason W Allen
    Journal of NeuroInterventional Surgery 2022 14 7
  • Peritherapeutic Hemodynamic Changes of Carotid Stenting Evaluated with Quantitative DSA in Patients with Carotid Stenosis
    M.M.H. Teng, F.-C. Chang, C.-J. Lin, L. Chiang, J.-S. Hong, Y.-H. Kao
    American Journal of Neuroradiology 2016 37 10
  • Prolonged cerebral circulation time is more associated with symptomatic carotid stenosis than stenosis degree or collateral circulation
    Yong-Sin Hu, Wan-Yuo Guo, I-Hui Lee, Feng-Chi Chang, Chung-Jung Lin, Chun-Jen Lin, Chao-Bao Luo, Chih-Chun Wu, Han-Jui Lee
    Journal of NeuroInterventional Surgery 2018 10 5
  • Evaluating cerebral hemodynamics using quantitative digital subtraction angiography and flat-detector computed tomography perfusion imaging: A comparative study in patients with carotid stenosis
    Liang-Wei Chen, Chung-Jung Lin, Wan-Yuo Guo, Sheng-Che Hung, Han-Jui Lee, Ko-Kung Chen, Feng-Chi Chang, Chao-Bao Luo, Wei-Fa Chu
    Journal of the Chinese Medical Association 2018 81 11
  • Cerebral venous circulation changes caused by aneurysmal subarachnoid hemorrhage
    S. Wang, B. Li, T. Yin, J. Hong, J. Gu, L. Wei
    Clinical Hemorheology and Microcirculation 2020 74 2
  • Different Grades of Collateral Circulation for Evaluating Cerebral Hemodynamic Status in Carotid Artery Stenosis
    Weijian Fan, Weihao Shi, Jianjie Rong, Wencheng Guo, Shuangshuang Lu, Jinyun Tan, Bo Yu, Kalidoss Rajakani
    Journal of Healthcare Engineering 2022 2022
  • Multimodal MRI study of the relationship between plaque characteristics and hypoperfusion in patients with transient ischemic attack
    Ying Sui, Jiali Sun, Yue Chen, Wei Wang
    Frontiers in Neurology 2023 14
  • Peri-therapeutic multi-modal hemodynamic assessment and detection of predictors for symptomatic in-stent restenosis after percutaneous transluminal angioplasty and stenting
    Xiaowen Song, Hancheng Qiu, Shuo Yang, Yuqi Liu, Yong Cao, Shuo Wang, Jizong Zhao
    Frontiers in Neurology 2023 14
  • Quantitative hemodynamic assessment of stenotic below‐the‐knee arteries using spatio‐temporal bolus tracking on 4D‐CT angiography
    Pieter Thomas Boonen, Nico Buls, Gert van Gompel, Hannes Devos, Yannick de Brucker, Tim Leiner, Dimitri Aerden, Johan de Mey, Jef Vandemeulebroucke
    Medical Physics 2023 50 11
  • Early Microcirculatory Hemodynamic Changes Are Correlated With Functional Outcomes at Discharge in Patients With Aneurysmal SAH
    Lili Wen, Longjiang Zhou, Qi Wu, Xiaoyu Tang, Jiajia Ge, Xiaoming Zhou, Xin Zhang
    Frontiers in Neurology 2022 12

More in this TOC Section

  • Proximal Vertebral Artery Variants and Embryology
  • High-Risk Plaque Features in Carotid MRI
  • Nonstenotic Carotid Plaques and Stroke Review
Show more Extracranial Vascular

Similar Articles

Advertisement

Indexed Content

  • Current Issue
  • Accepted Manuscripts
  • Article Preview
  • Past Issues
  • Editorials
  • Editors Choice
  • Fellow Journal Club
  • Letters to the Editor

Cases

  • Case Collection
  • Archive - Case of the Week
  • Archive - Case of the Month
  • Archive - Classic Case

Special Collections

  • Special Collections

Resources

  • News and Updates
  • Turn around Times
  • Submit a Manuscript
  • Author Policies
  • Manuscript Submission Guidelines
  • Evidence-Based Medicine Level Guide
  • Publishing Checklists
  • Graphical Abstract Preparation
  • Imaging Protocol Submission
  • Submit a Case
  • Become a Reviewer/Academy of Reviewers
  • Get Peer Review Credit from Publons

Multimedia

  • AJNR Podcast
  • AJNR SCANtastic
  • Video Articles

About Us

  • About AJNR
  • Editorial Board
  • Not an AJNR Subscriber? Join Now
  • Alerts
  • Feedback
  • Advertise with us
  • Librarian Resources
  • Permissions
  • Terms and Conditions

American Society of Neuroradiology

  • Not an ASNR Member? Join Now

© 2025 by the American Society of Neuroradiology All rights, including for text and data mining, AI training, and similar technologies, are reserved.
Print ISSN: 0195-6108 Online ISSN: 1936-959X

Powered by HighWire