
Abstract
BACKGROUND AND PURPOSE: Signal analysis of FLAIR sequences is gaining momentum for studying neurodevelopment and brain maturation, but FLAIR intensity varies across scanners and needs to be normalized. This study aimed to establish normative values for standardized FLAIR intensity in the pediatric brain.
MATERIALS AND METHODS: A new automated algorithm for signal normalization was used to standardize FLAIR intensity across scanners and subjects. Mean intensity was extracted from GM, WM, deep GM, and cortical GM regions. Regression curves were fitted across the pediatric age range, and ANOVA was used to investigate intensity differences across age groups. Correlations between intensity and regional volume were also examined.
RESULTS: We analyzed 429 pediatric FLAIR sequences in children 2–19 years of age with a median age of 11.2 years, including 199 males and 230 females. WM intensity had a parabolic relationship with age, with significant differences between various age groups (P < .05). GM and cortical GM intensity increased over the pediatric age range, with significant differences between early childhood and adolescence (P < .05). There were no significant relationships between volume and intensity in early childhood, while there were significant positive and negative correlations (P < .05) in WM and GM, respectively, for increasing age groups. Only the oldest age group showed significant differences between males and females (P < .05).
CONCLUSIONS: This work presents a FLAIR intensity standardization algorithm to normalize intensity across large data sets, which allows FLAIR intensity to be used to compare regions and individuals as a surrogate measure of the developing pediatric brain.
ABBREVIATIONS:
- cGM
- cortical gray matter
- dGM
- deep gray matter
Many diseases and disorders are associated with abnormal brain development in children, including autism spectrum disorder, attention deficit/hyperactivity disorder, and epilepsy.1 Maturation curves are used to identify children with normal, delayed, or abnormal brain maturation. Normative maturation trajectories have been established for various MR imaging sequences in the pediatric age range.2⇓⇓-5 FLAIR sequences are a mainstay of brain imaging, but there is currently limited information on maturation trajectories because signal intensities vary widely across FLAIR MR imaging scanners. In a previous study,3 the authors examined normal brain maturation on FLAIR for children 1 day to 4 years of age and found that FLAIR signal intensity had a biphasic pattern in WM regions in the first 48 months of life. Several other studies researched maturation patterns in young children, mainly in the first 2 years of life, using various sequences including T1, T2, FLAIR, DTI, as well as T1 and T2 mapping.2,4,5 However, little is known about brain maturation patterns of FLAIR signal intensities across the entire pediatric age range.
FLAIR signal intensities have been shown to be related to lipid and water content6 and may serve as good indicators of structural development and maturation-related brain development. There is wide variability of FLAIR signal intensity patterns across MR imaging scanners, making comparing intensities for large data sets challenging. FLAIR intensity standardization algorithms can be used across individuals and scanners to overcome this variability. In the past, Nyúl was the most widely used MR imaging intensity normalization scheme, but this method is optimized for T1 and T2 images.7,8 Reiche et al8 developed a normalization algorithm specifically for FLAIR MR imaging, which outperformed Nyul by demonstrating high alignment accuracy in large multicenter data sets.9 This work applies the FLAIR normalization technique to study pediatric brain changes during childhood and adolescence. We aimed to assess T2-weighted FLAIR signal intensities in individuals 2 to 19 years of age without structural abnormalities to establish normative maturation trajectories.
MATERIALS AND METHODS
This study was approved by the Hospital for Sick Children's local institutional review board. Due to the retrospective nature of the study, informed consent was waived by the local research ethics board. T2-weighted FLAIR and T1 MR imaging were performed in the clinical setting, and findings were reported as normal. Imaging was acquired across MR imaging scanners from 3 vendors (Sigma HDxt, GE Healthcare; Achieva, Philips Healthcare; Magnetom Skyra, Siemens), at field strengths of 1.5T or 3T. Section thicknesses of the FLAIR sequences ranged between 3 and 5 mm. Acquired in-plane voxel dimensions ranged between 0.6 and 1 mm. TR, TI, and TE ranged between 7 and 10 seconds, 2.3 and 2.9 seconds, and 85–150 ms, respectively. For the 3D T1-weighted sequence, section thickness ranged between 1 and 2 mm; the acquired in-plane voxel dimension was 1 mm; and TR, TE, and flip angle were 6–10 ms, 2–5 ms, and 7°–15°, respectively.
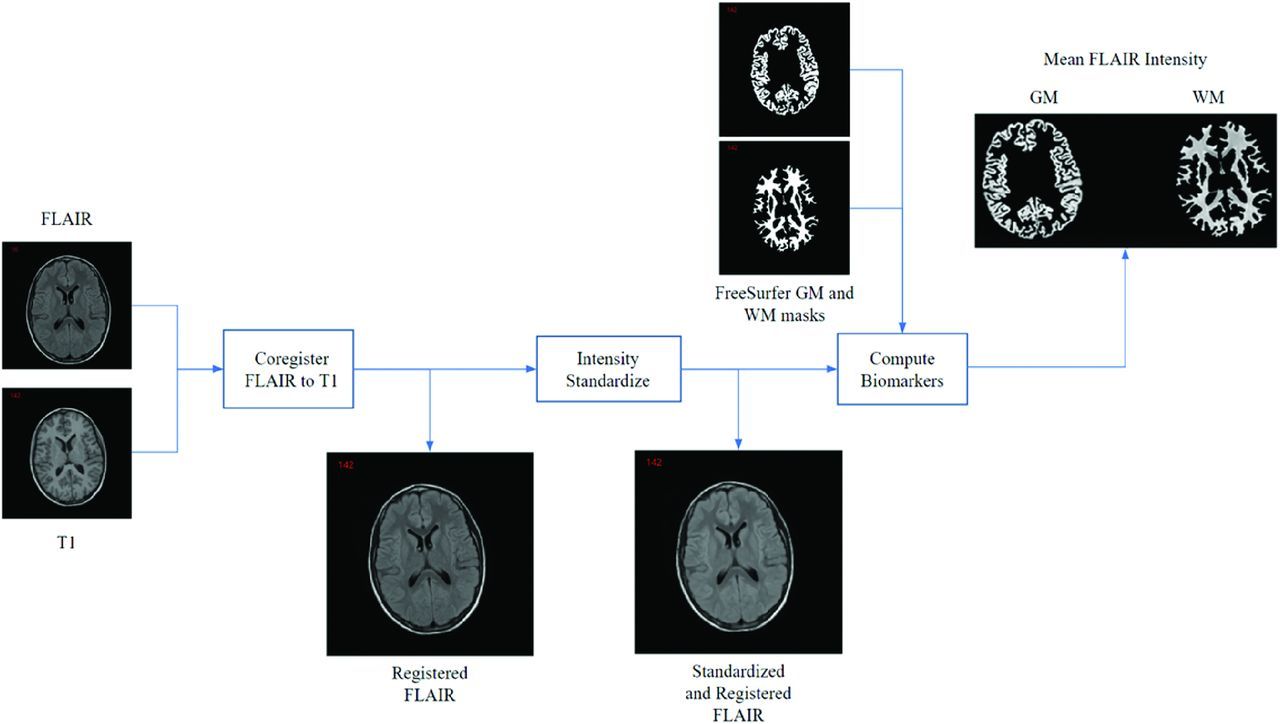
The various algorithms used are summarized in Fig 1 to compare FLAIR signal intensities from different scanners and individuals. FLAIR volumes were registered to the T1 space using the Advanced Normalization Tools software package (http://stnava.github.io/ANTs) symmetric normalization.10 Following registration, FLAIR images were N4 bias field–corrected11 followed by intensity normalization. The signal intensity normalization is a patented technology developed specifically for multicenter FLAIR MR imaging.8 It aligns the peaks of 2 histograms using a scaling factor defined as the ratio of the 2 histogram peaks. Given that GM comprises the largest volume, the GM histogram peaks of all volumes are aligned. The Kullback-Leibler divergence, which measures the degree of similarity between histograms, was used to quantify standardization performance.8

Image-processing pipeline for measuring FLAIR intensity biomarkers.
FreeSurfer, Version 7.2 (http://surfer.nmr.mgh.harvard.edu)12 was used to segment WM and GM regions on 3D T1-weighted images, and the masks were verified by a pediatric neuroradiologist. GM subregions, deep GM (dGM), and cortical GM (cGM) were also segmented and verified. The segmentations were used to mask the respective regions on FLAIR images, and the mean standardized FLAIR signal intensities were measured for each region to compute intensity features. For each individual, the mean intensity biomarkers were examined across age for the WM, GM, cGM, and dGM. The difference in GM and WM intensity was also considered.
Nonlinear regression was used to fit curves for examining tissue intensity trends across the age range. Quadratic curves were generated separately for females and males. The standard errors of the curve coefficients and P values are reported. ANOVA and the Tukey post hoc tests were used to evaluate differences in intensities across age groups and sexes. The first comparison investigates differences in intensities among age groups. The second analysis considers each age group while comparing intensities between males and females. To investigate the dependence of FLAIR intensity on volumetric changes, we correlated each tissue volume normalized by intracranial volume to the mean intensity of the corresponding regions using Pearson correlation tests.
RESULTS
Axial FLAIR and sagittal 3D T1-weighted FLAIR sequences of 512 children between 2 and 19 years of age were included in the study. Forty-four data sets with marked registration errors were excluded, and sequences of 39 patients with poor segmentation masks were discarded, leading to a final data set of 429 FLAIR and T1-weighted sequences (median age of 11.2 years and 199/230 male/female split), summarized in the Table. To examine the intensity standardization on pathologic brains and demonstrate proof of concept, we have included 2 FLAIR sequences acquired at the same center of atypical teratoid/rhabdoid tumor and stroke.
Cohort summary
Intensity Standardization
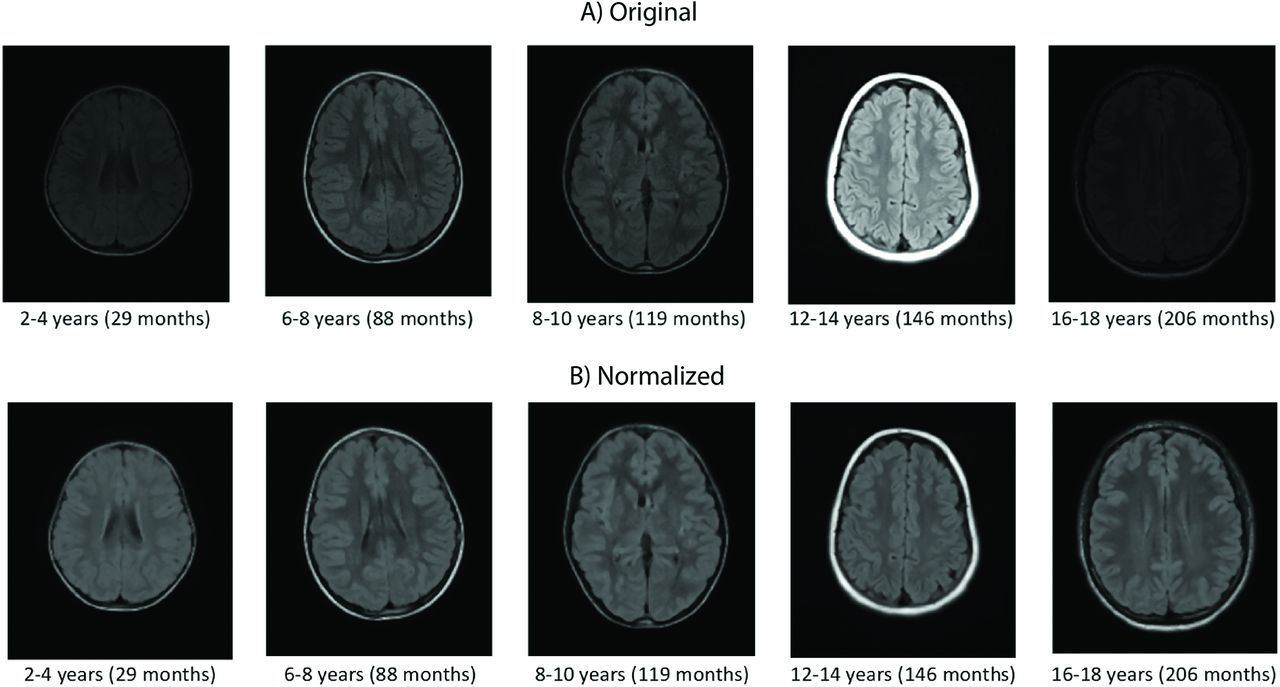
Sample original and standardized images of WM and GM are shown in Fig 2. Before normalization, the intensity histograms demonstrated different ranges for similar tissues. The mean Kullback–Leibler divergences before and after normalization were 1.303 and 0.006, respectively (Online Supplemental Data). The variability of the data after normalization was much lower, indicating that the multiscanner intensity variation was reduced, permitting fair comparison of intensity biomarkers across individuals. Intensity histograms of the FLAIR volumes before and after intensity normalization are shown in the Online Supplemental Data, while histograms across different age ranges are also shown in the Online Supplemental Data. To demonstrate the utility of the standardization framework, one can visualize the original and standardized images of the pathologic brains in the Online Supplemental Data. The standardized images have much better intensity alignment than the original ones.

Samples from different age ranges (original images, A) and images after intensity normalization (B). Approximate middle section taken from each subject.
Intensity Biomarkers across the Pediatric Age Range
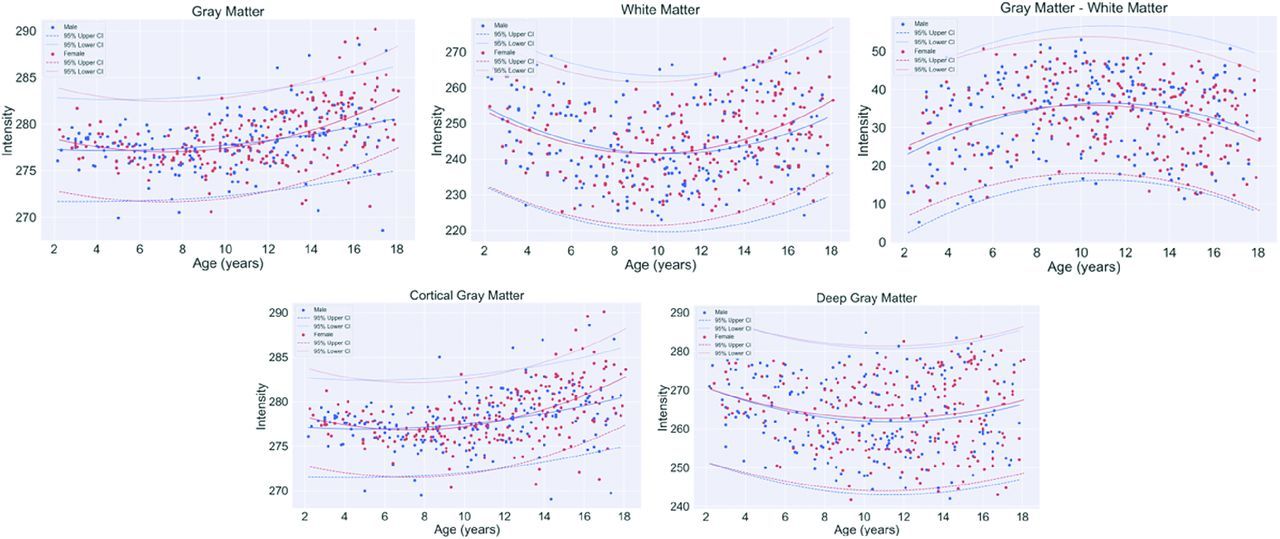
By means of the intensity-normalized FLAIR volumes and corresponding registered masks for WM, GM, dGM, and cGM, the mean intensity in each region was extracted for every individual. Figure 3 shows the fitted curves of intensity biomarkers as a function of age for all tissues. GM intensity demonstrated a quadratic profile with a slight increasing trend, while WM intensity demonstrated a biphasic pattern, with minimums in the approximate 8- to 12-year age range for both WM and GM. The absolute difference in GM and WM intensity demonstrated that WM intensity was lower than GM intensity across all age ranges, with more similar intensities in early childhood and adolescence, and the largest difference at 8–10 years of age. For most age ranges, male and female intensity profiles in both tissues were similar. In a GM subanalysis, dGM and cCM demonstrated nonlinear patterns, with slight upward trends in cGM. There was lower variability in intensities in the cGM than the dGM. The standard errors and P values from the models are shown in the Online Supplemental Data. All relationships were significant (P < .05).

Fitted curves of mean normalized intensity by age per tissue region for all 429 healthy pediatric patients.
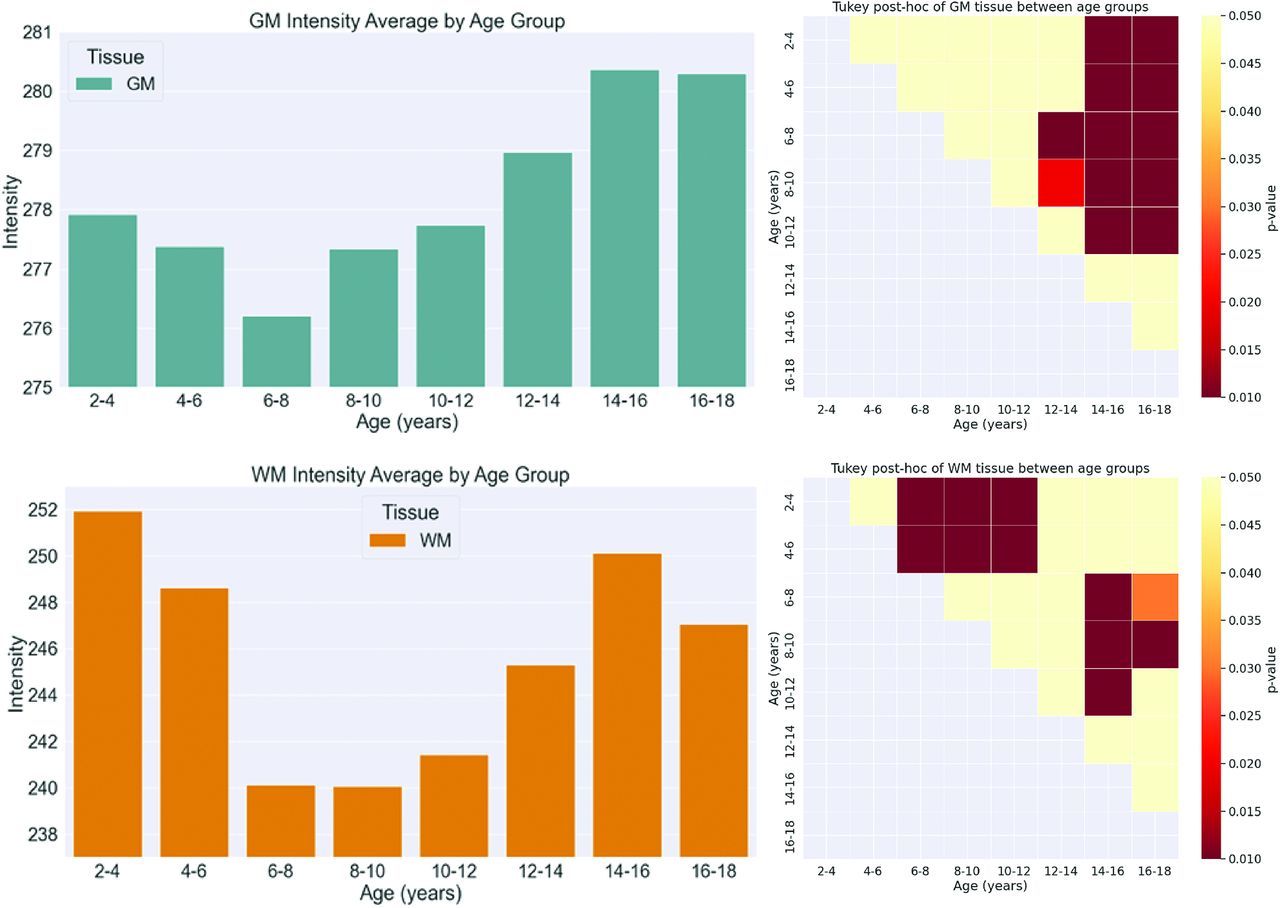
The distribution of FLAIR intensities of each tissue region across age groups is shown in the Online Supplemental Data, while the mean FLAIR intensity across all age ranges is summarized in the Online Supplemental Data. ANOVA demonstrated significant differences in intensity across age ranges for all tissues (P < .05) (Online Supplemental Data). The Tukey post hoc test was used to further analyze differences among age groups (Online Supplemental Data). The mean intensities and significant differences among age groups for each region are visualized in Fig 4 and the Online Supplemental Data. In WM, there were significant differences in intensity between early childhood (2–6 years) and 6–12 years of age. Significant differences were also observed between the age ranges of 6–12 years and 14–18 years, reflecting the biphasic pattern. For GM, significant differences (P < .05) were mostly observed when comparing intensities between the age ranges of 2–10 years and 14–18 years. The cGM followed patterns similar to those of the GM, whereas there were almost no differences across all ages for the dGM. The results of ANOVA comparing mean intensities between boys and girls for every age group are shown in the Online Supplemental Data. Significant differences (P < .05) between boys and girls were found only in the GM for the 16- to 18-year age group.

Mean intensity (left) and P value heatmap for intensity comparison for 2 age groups (right) for GM (upper row) and WM (lower row).
Volume Correlation
Correlation analysis between intensity and volume for 4 nonoverlapping age groups was performed as shown in Fig 5, while correlations across all ages are shown in the Online Supplemental Data. The 4 age ranges were the following: 2 ≤ age <6 years, 6 ≤ age <10 years, 10 ≤ age <14 years, 14 ≤ age ≤18.2 years. In GM, there was a significant negative correlation (P < .05) between intensity and GM volume for all age groups except in the 2- to 6-year age range. The cGM had trends similar to those in the GM, and the dGM demonstrated weak insignificant correlations for all age groups. In WM, there was a significant positive correlation (P < .05) between intensity and WM volume for the 2 older age groups, while there was no significant correlation in the 2- to 6- and 6- to 10-year age groups.

Volume versus intensity for GM, WM, cGM, and dGM. Regression is performed for 4 age groups. ICV indicates intracranial volume.
DISCUSSION
This study analyzed normalized FLAIR signal intensity in the GM and WM regions of normative individuals across the pediatric age range. A FLAIR intensity normalization method was used to ensure that individuals could be compared across the pediatric cohort. A total of 429 children ranging from 2 years to 18.2 years of age were studied. The mean FLAIR intensity was extracted from the GM, WM, cGM, and dGM. Regression analysis was performed to fit curves across the pediatric age range, and ANOVA and post hoc analyses investigated differences in biomarkers across age groups. Correlation analysis was performed to investigate relationships between intensity and changes in brain volume.
As shown in Fig 3, a quadratic relationship between intensity and age was found in the WM, and an increasing trend was found in the GM regions. The difference in GM and WM intensity also followed a quadratic trend. In Ashikaga et al,3 FLAIR signal-intensity differences between GM and WM had a biphasic pattern for the frontal and occipital deep WM and the centrum semiovale in the first 48 months of life. It was shown that WM progressed from hyper- to hypointense compared with adjacent GM during the first 2 years of life.3 Similarly, in Kizildağ et al,2 a study of children ranging from 0 to 2 years of age showed that brain maturation can be demonstrated on FLAIR images as well as with T1-weighted and T2-weighted images. While these related works focus on early life, they showed that changes in intensity occur in the developing brain and that FLAIR can be used to measure them. Moreover, few studies investigated FLAIR signal intensities beyond the first few years of life. In this work, we automatically characterize brain changes using FLAIR intensity over the entire pediatric age range. We also use a validated standardization method to normalize the FLAIR intensities to allow comparisons across a large pediatric data set.
The first few years of life involve substantial volumetric and morphologic changes, including large increases in total brain volume along with WM and GM volume.13 By 6 years of age, total brain volume has reached approximately 90% of adult values, with incremental increases throughout the remainder of childhood and into adolescence.13 Previous volumetric studies on MR imaging across the pediatric age range have shown an increase of WM and a decrease of GM with age, while the total brain volume remains fairly constant.14 Our results demonstrated an increase in GM FLAIR intensity, with the highest increase after 12 years of age. The correlation between GM intensity and volume showed that GM volume decreases while FLAIR intensity increases with age. Significant negative correlations were found between intensity and volume in older children (6–18 years), with the most rapid changes occurring in the 10- to 18-year age range. In the early years of life (2–6 years), intensity and volume were not correlated. Changes in GM volume are associated with cortical thickness decreases13 and cortical surface area/degree of gyrification reductions15 due to arborization, axonal growth, increase in pyramidal cell somata, synaptogenesis, and synapse elimination (pruning).16 Therefore, FLAIR intensity may present a novel way to measure these microstructural GM changes. When we examined GM compartments, cGM followed intensity and volume trajectories similar to those of the entire GM region, but minimal changes in the dGM were found. Neurobiologically, these tissues differ in composition. The cGM contains mostly excitatory neurons, whereas dGM contains both excitatory and inhibitory neurons. These neurobiological differences may explain the differing trends in the 2 tissue types.
Previous DTI studies also found quadratic patterns of fractional anisotropy in WM regions of children, which peak in late adolescent years13 and are thought to be related to increased fiber density, axonal diameter, and myelination. Increasing WM volume over the pediatric age range is related to normal maturation processes such as myelination and increased axonal size and packing.17 Increased axonal packing is accompanied by decreasing water content, while axon coherence remains stable across brain development.13 Correlations between WM intensity and volume showed higher WM volume associated with higher FLAIR intensity, with significant correlations at 6–18 years of age and the highest intensity increases occurring at 10 years of age and older. This finding indicates a more rapid increase in intensity for smaller volume changes in older age groups. Because most myelination is completed early in life but continues into adulthood, FLAIR intensity may be a surrogate marker of the dynamic process of myelination, axonal packing, and water diffusion that could complement current studies. Longitudinal studies would be needed to study this effect further.
Studies are emerging showing the value of FLAIR MR imaging biomarkers18,19 for dementia and cerebrovascular disease. Intensity was found to be strongly correlated with mean diffusivity in DTI,18 indicating that FLAIR intensity is related to water diffusion properties of the tissue. Therefore, changes in FLAIR intensity in this study may be related to water content and tissue organization in the WM and GM regions of children, but histologic studies would be needed to confirm this hypothesis. The benefit of the current approach is that DTI volumes are not required for biomarker measurement. DTI not only has long acquisition and preprocessing times but also has wide variability in its measurements.20 In contrast, the FLAIR intensity standardization framework normalizes intensities and allows robust comparison across subjects. Because FLAIR is routinely acquired in clinical brain imaging investigations, FLAIR intensity biomarkers have wide translation potential.
Possible limitations in this work include segmentation or registration errors. While segmentations and scans were examined visually to reduce errors, there could be artifacts that are difficult to detect with the human eye. Future work may include implementing a deep learning–based registration21 or segmentation scheme,22 with automated failure detection to reject poor-quality images. We could also improve the normalization tool by aligning specific tissue regions or making alignment less dependent on the main histogram mode. However, we wanted to avoid dependence on segmentation accuracy for the normalization scheme. Last, future work would include further validation of the FLAIR intensity biomarkers by comparing the FLAIR normative curves with biomarkers from children with neurodevelopmental disorders. Additionally, longitudinal studies will be required to investigate intensity changes on the individual level.
CONCLUSIONS
We have explored how normalized FLAIR signal intensity changes across the pediatric age range. There was a biphasic pattern in WM, while GM intensity gradually increased. There were minimal differences noted in the dGM, whereas cGM showed similar trends to GM. There were no significant differences between females and males, except in the GM in late adolescence. There were no significant relationships between intensity and volume for the first 2–6 years of life in both GM and WM. However, with increasing age, volume was directly proportional to intensity in the WM and inversely related to GM intensity. This is one of the first large-scale studies on FLAIR intensity across the pediatric age range and can be used in future studies to analyze pathology and abnormal brain development.
Footnotes
This work was supported by a Natural Sciences and Engineering Research Council of Canada Discovery Grant (April Khademi).
Disclosure forms provided by the authors are available with the full text and PDF of this article at www.ajnr.org.
Indicates open access to non-subscribers at www.ajnr.org
References
- Received May 10, 2023.
- Accepted after revision July 18, 2023.
- © 2023 by American Journal of Neuroradiology


Jump to section
Related Articles
Cited By...
- No citing articles found.